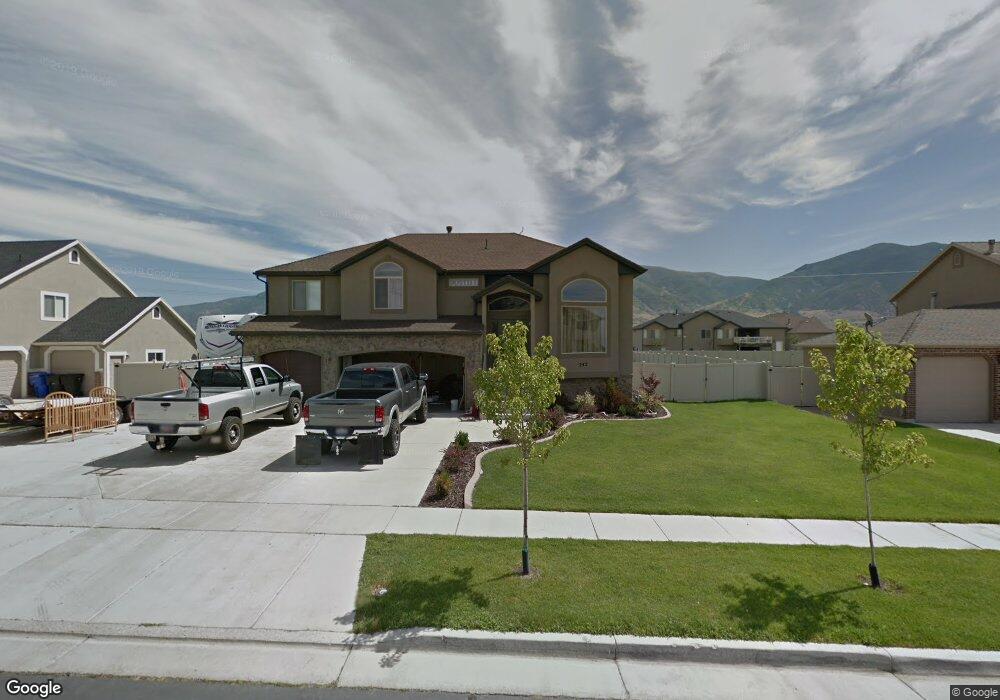
242 Ranch Rd Farmington, UT 84025
Estimated Value: $702,000 - $746,000
5
Beds
3
Baths
2,635
Sq Ft
$276/Sq Ft
Est. Value
About This Home
This home is located at 242 Ranch Rd, Farmington, UT 84025 and is currently estimated at $726,772, approximately $275 per square foot. 242 Ranch Rd is a home located in Davis County with nearby schools including Eagle Bay Elementary School, Farmington High, and Farmington Junior High School.
Ownership History
Date
Name
Owned For
Owner Type
Purchase Details
Closed on
Sep 20, 2016
Sold by
Servey James A
Bought by
Trump Matthew F
Current Estimated Value
Purchase Details
Closed on
Jun 2, 2010
Sold by
Hamberlin Mark A
Bought by
Servey James A
Home Financials for this Owner
Home Financials are based on the most recent Mortgage that was taken out on this home.
Original Mortgage
$285,159
Interest Rate
5.05%
Mortgage Type
FHA
Purchase Details
Closed on
Jan 3, 2008
Sold by
Rigby Construction Inc
Bought by
Hamberlin Mark A
Home Financials for this Owner
Home Financials are based on the most recent Mortgage that was taken out on this home.
Original Mortgage
$249,600
Interest Rate
6.15%
Mortgage Type
Purchase Money Mortgage
Purchase Details
Closed on
May 15, 2006
Sold by
Boyer Wheeler Farm Lc
Bought by
Rigby Construction Inc
Home Financials for this Owner
Home Financials are based on the most recent Mortgage that was taken out on this home.
Original Mortgage
$630,000
Interest Rate
6.55%
Mortgage Type
Purchase Money Mortgage
Create a Home Valuation Report for This Property
The Home Valuation Report is an in-depth analysis detailing your home's value as well as a comparison with similar homes in the area
Home Values in the Area
Average Home Value in this Area
Purchase History
| Date | Buyer | Sale Price | Title Company |
|---|---|---|---|
| Trump Matthew F | -- | Us Title Company Of Utah | |
| Servey James A | -- | Executive Title Ins Agenc | |
| Hamberlin Mark A | -- | Bonneville Superior Title Co | |
| Rigby Construction Inc | -- | Bonneville Title Company |
Source: Public Records
Mortgage History
| Date | Status | Borrower | Loan Amount |
|---|---|---|---|
| Previous Owner | Servey James A | $285,159 | |
| Previous Owner | Hamberlin Mark A | $249,600 | |
| Previous Owner | Rigby Construction Inc | $630,000 |
Source: Public Records
Tax History Compared to Growth
Tax History
| Year | Tax Paid | Tax Assessment Tax Assessment Total Assessment is a certain percentage of the fair market value that is determined by local assessors to be the total taxable value of land and additions on the property. | Land | Improvement |
|---|---|---|---|---|
| 2025 | $3,679 | $343,200 | $169,766 | $173,434 |
| 2024 | $3,517 | $332,750 | $143,473 | $189,277 |
| 2023 | $3,430 | $595,000 | $226,698 | $368,302 |
| 2022 | $3,360 | $329,450 | $123,638 | $205,812 |
| 2021 | $3,064 | $446,000 | $136,381 | $309,619 |
| 2020 | $2,793 | $396,000 | $129,973 | $266,027 |
| 2019 | $2,793 | $387,000 | $140,943 | $246,057 |
| 2018 | $2,577 | $352,000 | $128,059 | $223,941 |
| 2016 | $2,510 | $180,785 | $59,699 | $121,086 |
| 2015 | $2,385 | $162,745 | $59,699 | $103,046 |
| 2014 | $2,312 | $162,143 | $48,527 | $113,616 |
| 2013 | -- | $152,867 | $36,176 | $116,691 |
Source: Public Records
Map
Nearby Homes
- 556 Innovator Dr Unit 158
- 2081 Colt Dr
- 1843 W Burke Ln Unit 103
- 234 N Dexter Cir
- Harvard Plan at Eastridge Estates
- Fortissimo Plan at Eastridge Estates
- Crescendo Plan at Eastridge Estates
- Browning Plan at Eastridge Estates
- Adagio Plan at Eastridge Estates
- Harrison Plan at Eastridge Estates
- Timpani Plan at Eastridge Estates
- Ballad Plan at Eastridge Estates
- Anthem Plan at Eastridge Estates
- Bravo Plan at Eastridge Estates
- Canon Plan at Eastridge Estates
- Treble Plan at Eastridge Estates
- Madrigal Plan at Eastridge Estates
- Trio Plan at Eastridge Estates
- Tempo Plan at Eastridge Estates
- Tenor Plan at Eastridge Estates
- 246 Ranch Rd
- 228 Ranch Rd
- 216 Ranch Rd
- 264 Ranch Rd
- 2131 Stampede Dr Unit 622
- 223 Ranch Rd
- 229 Ranch Rd Unit 604
- 209 Ranch Rd
- 2134 Stampede Dr
- 243 Ranch Rd Unit 805
- 243 Ranch Rd
- 281 Prairie View Cove
- 204 Ranch Rd
- 204 Ranch Rd Unit lot448
- 278 Ranch Rd Unit 634
- 278 Ranch Rd
- 278 Ranch Rd Unit 634
- 191 Ranch Rd
- 2113 Stampede Dr
- 2112 Lonestar Dr