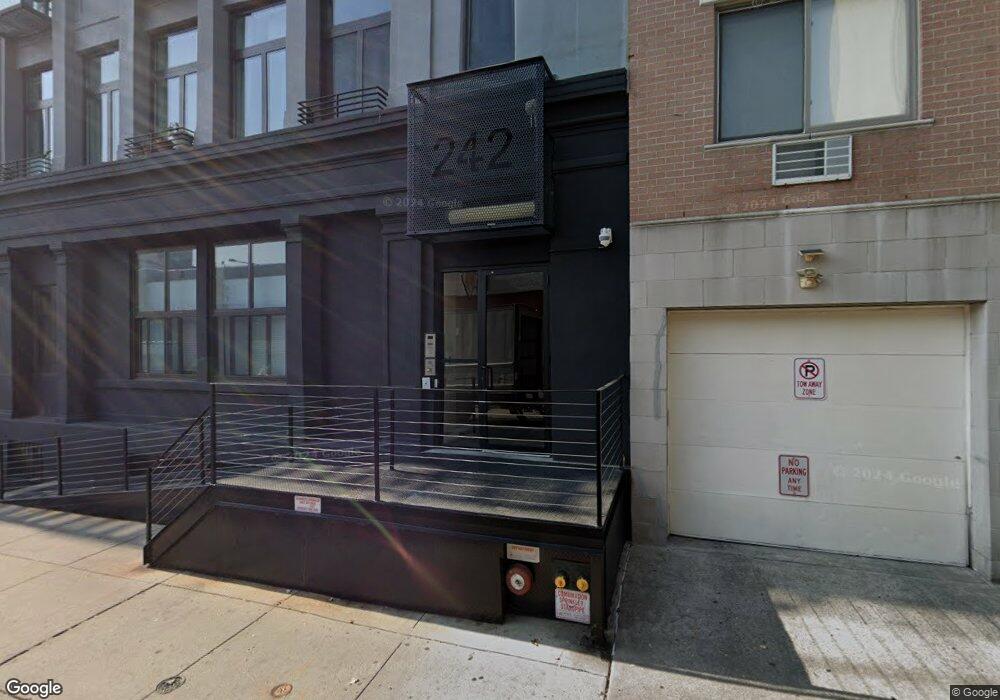
242 S 1st St Unit 2A Brooklyn, NY 11211
Williamsburg NeighborhoodEstimated Value: $642,128 - $944,000
--
Bed
1
Bath
563
Sq Ft
$1,447/Sq Ft
Est. Value
About This Home
This home is located at 242 S 1st St Unit 2A, Brooklyn, NY 11211 and is currently estimated at $814,532, approximately $1,446 per square foot. 242 S 1st St Unit 2A is a home located in Kings County with nearby schools including P.S. 17 Henry D Woodworth and Success Academy Williamsburg.
Ownership History
Date
Name
Owned For
Owner Type
Purchase Details
Closed on
Jul 9, 2018
Sold by
Rebek Eva
Bought by
G D O I Llc
Current Estimated Value
Purchase Details
Closed on
Nov 15, 2013
Sold by
Rebek Pouya
Bought by
Rebek Eva
Home Financials for this Owner
Home Financials are based on the most recent Mortgage that was taken out on this home.
Original Mortgage
$320,000
Interest Rate
4.29%
Mortgage Type
New Conventional
Purchase Details
Closed on
Jun 25, 2009
Sold by
Deguia Fernando G
Bought by
Rebek Pouya
Home Financials for this Owner
Home Financials are based on the most recent Mortgage that was taken out on this home.
Original Mortgage
$267,500
Interest Rate
5.31%
Mortgage Type
Purchase Money Mortgage
Purchase Details
Closed on
Nov 16, 2007
Sold by
242 South 1 Developers Llc
Bought by
Deguia Fernando G
Home Financials for this Owner
Home Financials are based on the most recent Mortgage that was taken out on this home.
Original Mortgage
$295,200
Interest Rate
6.48%
Mortgage Type
Purchase Money Mortgage
Create a Home Valuation Report for This Property
The Home Valuation Report is an in-depth analysis detailing your home's value as well as a comparison with similar homes in the area
Home Values in the Area
Average Home Value in this Area
Purchase History
| Date | Buyer | Sale Price | Title Company |
|---|---|---|---|
| G D O I Llc | $540,000 | -- | |
| G D O I Llc | $540,000 | -- | |
| Rebek Eva | $400,000 | -- | |
| Rebek Eva | $400,000 | -- | |
| Rebek Pouya | $367,500 | -- | |
| Rebek Pouya | $367,500 | -- | |
| Deguia Fernando G | $369,000 | -- | |
| Deguia Fernando G | $369,000 | -- |
Source: Public Records
Mortgage History
| Date | Status | Borrower | Loan Amount |
|---|---|---|---|
| Previous Owner | Rebek Eva | $320,000 | |
| Previous Owner | Rebek Pouya | $267,500 | |
| Previous Owner | Deguia Fernando G | $295,200 |
Source: Public Records
Tax History Compared to Growth
Tax History
| Year | Tax Paid | Tax Assessment Tax Assessment Total Assessment is a certain percentage of the fair market value that is determined by local assessors to be the total taxable value of land and additions on the property. | Land | Improvement |
|---|---|---|---|---|
| 2025 | $6,788 | $62,951 | $1,143 | $61,808 |
| 2024 | $6,788 | $59,527 | $1,143 | $58,384 |
| 2023 | $6,566 | $59,063 | $1,143 | $57,920 |
| 2022 | $6,394 | $57,872 | $1,143 | $56,729 |
| 2021 | $5,929 | $50,703 | $1,143 | $49,560 |
| 2020 | $5,813 | $55,916 | $1,143 | $54,773 |
| 2019 | $5,606 | $55,663 | $1,143 | $54,520 |
| 2018 | $5,295 | $53,721 | $1,143 | $52,578 |
| 2017 | $5,154 | $48,103 | $1,143 | $46,960 |
| 2016 | $4,800 | $44,728 | $1,143 | $43,585 |
| 2015 | $2,403 | $42,282 | $1,143 | $41,139 |
| 2014 | $2,403 | $40,315 | $1,143 | $39,172 |
Source: Public Records
Map
Nearby Homes
- 227 S 2nd St Unit 6
- 230 S 2nd St
- 242 S 1st St Unit 2B
- 225 S 3rd St Unit 2
- 14 Hope St Unit 3F
- 251 S 3rd St Unit PHA
- 277 S 2nd St
- 241 Grand St
- 705 Driggs Ave Unit 13
- 340 Metropolitan Ave
- 340 Metropolitan Ave Unit PHB
- 280 Metropolitan Ave Unit 5-D
- 170 S 4th St
- 40 Bleecker St Unit 3H
- 40 Bleecker St Unit 3E
- 154 S 3rd St Unit 24
- 171 N 1st St Unit 2B
- 171 N 1st St Unit 3-K
- 171 N 1st St Unit 3-C
- 141 E 3rd St Unit 3I
- 242 S 1st St
- 242 S 1st St Unit ID1031960P
- 242 S 1st St Unit 4F
- 242 S 1st St Unit 4E
- 242 S 1st St Unit 4D
- 242 S 1st St Unit 4C
- 242 S 1st St Unit 4B
- 242 S 1st St Unit 4A
- 242 S 1st St Unit 3F
- 242 S 1st St Unit 3E
- 242 S 1st St Unit 3D
- 242 S 1st St Unit 3C
- 242 S 1st St Unit 3B
- 242 S 1st St Unit 3A
- 242 S 1st St Unit 2F
- 242 S 1st St Unit 2E
- 242 S 1st St Unit 2D
- 242 S 1st St Unit 2C
- 242 S 1st St Unit 1F
- 242 S 1st St Unit 1E