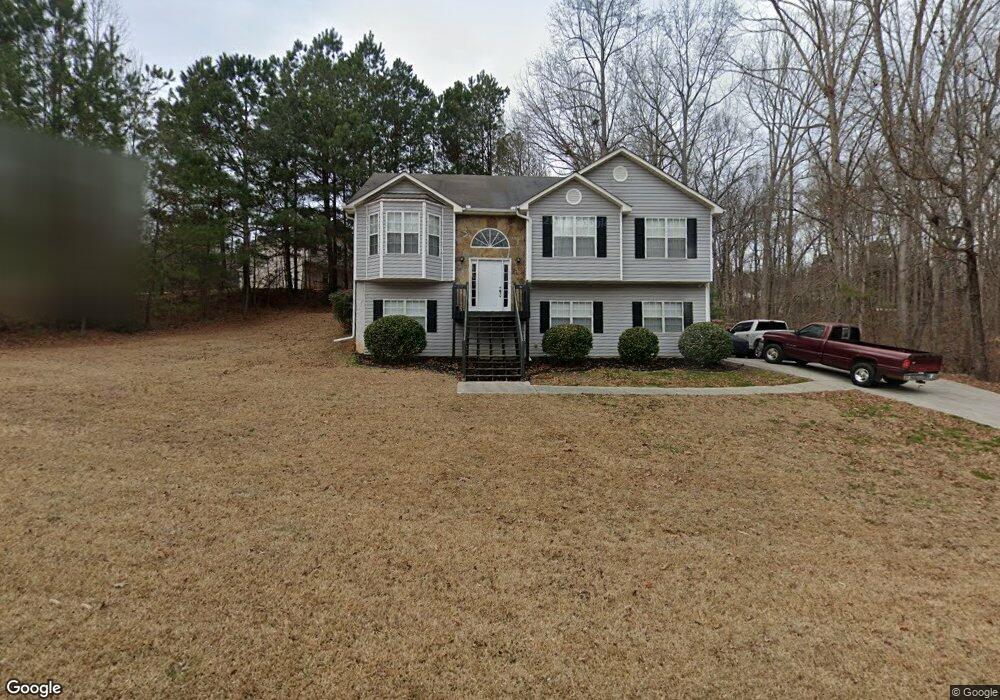
242 Tuscany Trace Dallas, GA 30157
Estimated Value: $296,000 - $318,000
3
Beds
2
Baths
1,472
Sq Ft
$207/Sq Ft
Est. Value
About This Home
This home is located at 242 Tuscany Trace, Dallas, GA 30157 and is currently estimated at $305,162, approximately $207 per square foot. 242 Tuscany Trace is a home located in Paulding County with nearby schools including Lillian C. Poole Elementary School, South Paulding Middle School, and Paulding County High School.
Ownership History
Date
Name
Owned For
Owner Type
Purchase Details
Closed on
Jul 5, 2016
Sold by
Brian A
Bought by
American Homes 4 Rent Properti
Current Estimated Value
Purchase Details
Closed on
Mar 2, 2009
Sold by
Cwalt Inc Trust 2005-84
Bought by
Tuggle Brian and Tuggle Jocelyn
Home Financials for this Owner
Home Financials are based on the most recent Mortgage that was taken out on this home.
Original Mortgage
$84,932
Interest Rate
5.13%
Mortgage Type
FHA
Purchase Details
Closed on
Nov 4, 2008
Sold by
Diallo Ibrahima B
Bought by
Cwalt Inc Alter Series 2005-84
Purchase Details
Closed on
Nov 21, 2005
Sold by
J D Martin Builder Inc
Bought by
Diallo Ibrahima B
Home Financials for this Owner
Home Financials are based on the most recent Mortgage that was taken out on this home.
Original Mortgage
$106,400
Interest Rate
7.37%
Mortgage Type
New Conventional
Create a Home Valuation Report for This Property
The Home Valuation Report is an in-depth analysis detailing your home's value as well as a comparison with similar homes in the area
Home Values in the Area
Average Home Value in this Area
Purchase History
| Date | Buyer | Sale Price | Title Company |
|---|---|---|---|
| American Homes 4 Rent Properti | $101,000 | -- | |
| Tuggle Brian | -- | -- | |
| Tuggle Brian | $86,500 | -- | |
| Cwalt Inc Alter Series 2005-84 | $101,150 | -- | |
| Diallo Ibrahima B | $133,000 | -- |
Source: Public Records
Mortgage History
| Date | Status | Borrower | Loan Amount |
|---|---|---|---|
| Previous Owner | Tuggle Brian | $84,932 | |
| Previous Owner | Diallo Ibrahima B | $106,400 |
Source: Public Records
Tax History Compared to Growth
Tax History
| Year | Tax Paid | Tax Assessment Tax Assessment Total Assessment is a certain percentage of the fair market value that is determined by local assessors to be the total taxable value of land and additions on the property. | Land | Improvement |
|---|---|---|---|---|
| 2024 | $3,082 | $123,900 | $12,000 | $111,900 |
| 2023 | $2,926 | $112,252 | $12,000 | $100,252 |
| 2022 | $1,746 | $66,980 | $10,000 | $56,980 |
| 2021 | $1,947 | $66,984 | $10,000 | $56,984 |
| 2020 | $1,989 | $66,972 | $10,000 | $56,972 |
| 2019 | $1,948 | $64,640 | $10,000 | $54,640 |
| 2018 | $1,809 | $60,060 | $10,000 | $50,060 |
| 2017 | $1,234 | $49,620 | $10,000 | $39,620 |
| 2016 | $1,483 | $50,920 | $10,000 | $40,920 |
| 2015 | $1,517 | $51,160 | $10,000 | $41,160 |
| 2014 | $1,424 | $46,960 | $10,000 | $36,960 |
| 2013 | -- | $23,800 | $8,000 | $15,800 |
Source: Public Records
Map
Nearby Homes
- 155 Tuscany Trail
- 553 Somersby Dr
- 53 Veranda Walk
- 330 Indian Hills Dr
- 1495 Scoggins Rd
- 140 Cyrilla Walk
- 128 Cyrilla Walk
- 438 Somersby Dr
- 000 Villa Rica Hwy
- 294 Paces Lakes Ridge
- 11 Paces Meadows Ln
- 85 Lakeview Point
- 64 Lakeview Point
- 76 Lakeview Dr
- 55 Lakeview Point
- 89 Paces Lakes Point
- 12 Paces Lakes Point
- 330 Tuscany Trace
- 241 Tuscany Trace Unit 12
- 241 Tuscany Trace
- 200 Tuscany Trace
- 207 Tuscany Trace
- 279 Tuscany Trace
- 279 Tuscany Trace
- 340 Tuscany Trace
- 263 Tuscany Trace
- 148 Tuscany Trace
- 74 Tuscany Trace
- 100 Tuscany Trace
- 358 Tuscany Trace
- 358 Tuscany Trace Unit 358
- 358 Tuscany Trace
- 339 Tuscany Trace
- 183 Tuscany Trace
- 291 Tuscany Trace
- 50 Tuscany Trace
- 301 Tuscany Trace