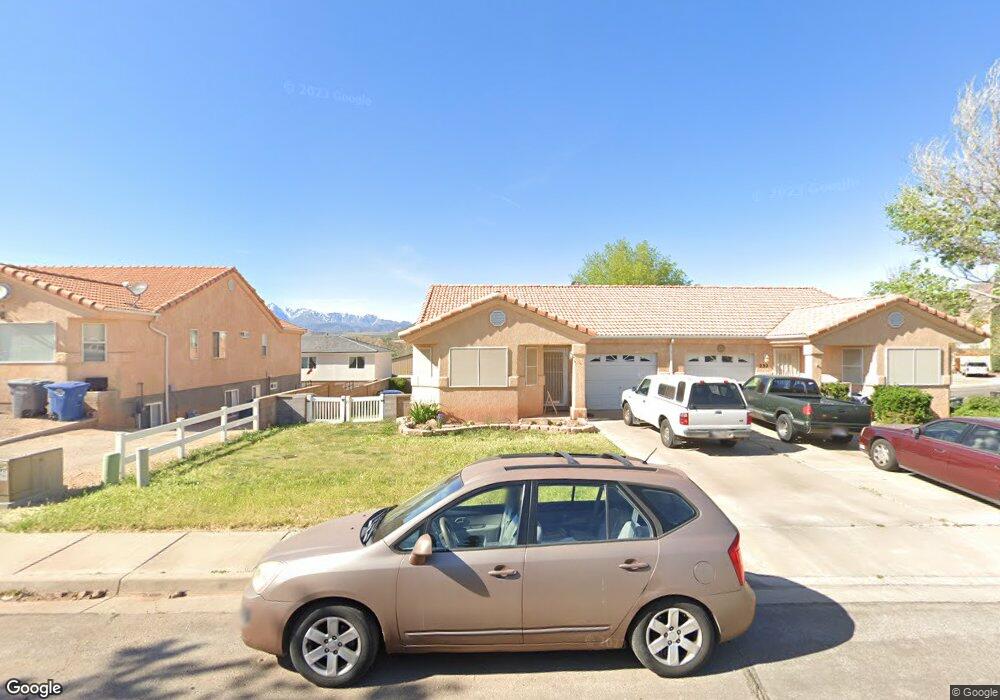
242 W 665 N La Verkin, UT 84745
Estimated Value: $310,105 - $324,000
3
Beds
2
Baths
1,171
Sq Ft
$270/Sq Ft
Est. Value
About This Home
This home is located at 242 W 665 N, La Verkin, UT 84745 and is currently estimated at $316,276, approximately $270 per square foot. 242 W 665 N is a home located in Washington County with nearby schools including La Verkin Elementary School, Hurricane Middle School, and Hurricane High School.
Ownership History
Date
Name
Owned For
Owner Type
Purchase Details
Closed on
Nov 25, 2014
Sold by
Goode Nathan E and Goode Sue A
Bought by
Parish Family Trust
Current Estimated Value
Purchase Details
Closed on
Jun 26, 2014
Sold by
Rose Tracy J and Rose Wayne R
Bought by
Goode Nathan E and Goode Sue A
Purchase Details
Closed on
Oct 4, 2011
Sold by
Triptow Joan L
Bought by
Rose Tracey J and Rose Wayne E
Home Financials for this Owner
Home Financials are based on the most recent Mortgage that was taken out on this home.
Original Mortgage
$42,300
Interest Rate
4.15%
Mortgage Type
New Conventional
Purchase Details
Closed on
Apr 26, 2006
Sold by
Hansen Samuel W
Bought by
Triptow Joan L
Home Financials for this Owner
Home Financials are based on the most recent Mortgage that was taken out on this home.
Original Mortgage
$140,100
Interest Rate
6.3%
Mortgage Type
New Conventional
Create a Home Valuation Report for This Property
The Home Valuation Report is an in-depth analysis detailing your home's value as well as a comparison with similar homes in the area
Home Values in the Area
Average Home Value in this Area
Purchase History
| Date | Buyer | Sale Price | Title Company |
|---|---|---|---|
| Parish Family Trust | -- | None Available | |
| Goode Nathan E | -- | Meridian Title Co | |
| Rose Tracey J | -- | Sun West Title | |
| Triptow Joan L | -- | United Title Services |
Source: Public Records
Mortgage History
| Date | Status | Borrower | Loan Amount |
|---|---|---|---|
| Previous Owner | Rose Tracey J | $42,300 | |
| Previous Owner | Triptow Joan L | $140,100 |
Source: Public Records
Tax History Compared to Growth
Tax History
| Year | Tax Paid | Tax Assessment Tax Assessment Total Assessment is a certain percentage of the fair market value that is determined by local assessors to be the total taxable value of land and additions on the property. | Land | Improvement |
|---|---|---|---|---|
| 2025 | $1,157 | $157,080 | $38,500 | $118,580 |
| 2023 | $1,163 | $154,165 | $35,750 | $118,415 |
| 2022 | $1,609 | $162,580 | $35,750 | $126,830 |
| 2021 | $1,140 | $209,400 | $45,000 | $164,400 |
| 2020 | $1,007 | $173,000 | $45,000 | $128,000 |
| 2019 | $914 | $150,500 | $45,000 | $105,500 |
| 2018 | $902 | $76,065 | $0 | $0 |
| 2017 | $816 | $66,165 | $0 | $0 |
| 2016 | $781 | $60,775 | $0 | $0 |
| 2015 | $727 | $54,395 | $0 | $0 |
| 2014 | $597 | $44,055 | $0 | $0 |
Source: Public Records
Map
Nearby Homes
- 248 W 665 N
- 248 W 665 N Unit A
- 232 W 665 N
- 691 N 220 W
- 254 W 665 N
- 695 N 220 W
- 685 N 275 W
- 685 N 275 W Unit 7
- 685 N 275 W Unit 3
- 685 N 275 W Unit 1
- 685 N 275 W Unit 2
- 685 N 275 W Unit 4
- 685 N 275 W Unit 5
- 685 N 275 W Unit 6
- 685 N 275 W Unit 1-7
- 686 N 275 W
- 686 N 275 W Unit 2
- 686 N 275 W Unit 3
- 686 N 275 W Unit 6
- 686 N 275 W Unit 5