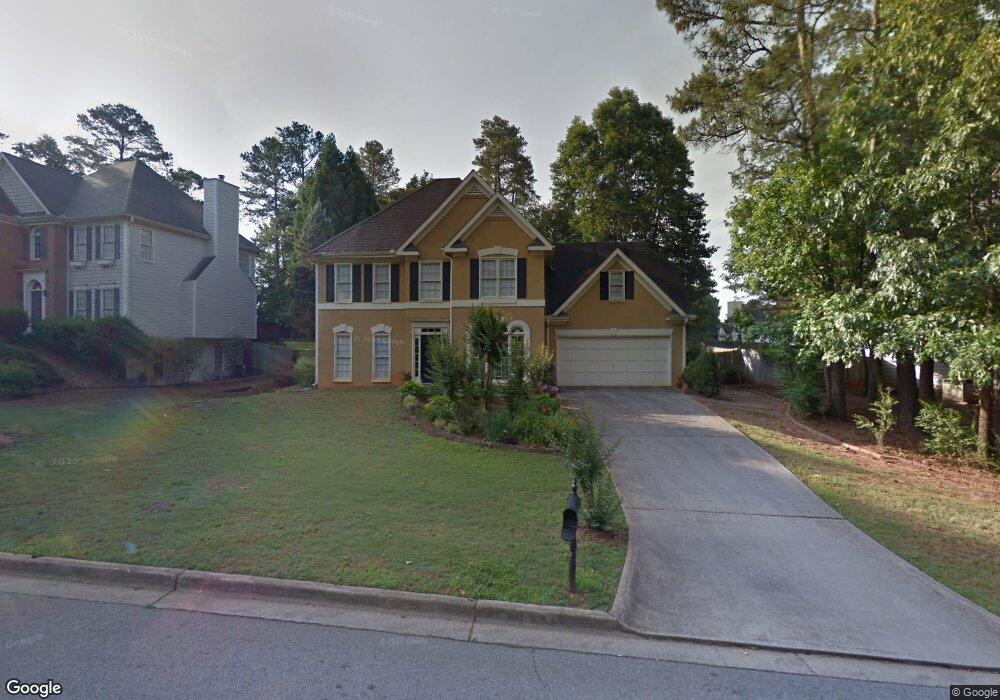
242 Waterford Cove Dr Unit 3 Suwanee, GA 30024
Estimated Value: $437,000 - $465,577
4
Beds
3
Baths
2,330
Sq Ft
$194/Sq Ft
Est. Value
About This Home
This home is located at 242 Waterford Cove Dr Unit 3, Suwanee, GA 30024 and is currently estimated at $452,144, approximately $194 per square foot. 242 Waterford Cove Dr Unit 3 is a home located in Gwinnett County with nearby schools including Walnut Grove Elementary School, Creekland Middle School, and Collins Hill High School.
Ownership History
Date
Name
Owned For
Owner Type
Purchase Details
Closed on
Jan 27, 2025
Sold by
Monzon Oscar Estuardo
Bought by
Monzon Oscar Estuardo Trust and Monzon Oscar Estuardo
Current Estimated Value
Purchase Details
Closed on
Jun 9, 2006
Sold by
Leblanc Sharon A
Bought by
Monzon Oscar E
Home Financials for this Owner
Home Financials are based on the most recent Mortgage that was taken out on this home.
Original Mortgage
$224,074
Interest Rate
6.49%
Mortgage Type
FHA
Purchase Details
Closed on
Aug 22, 1997
Sold by
Hampon Edward D and Hampon Paula J
Bought by
Hinton Sharon A
Home Financials for this Owner
Home Financials are based on the most recent Mortgage that was taken out on this home.
Original Mortgage
$151,900
Interest Rate
7.43%
Mortgage Type
New Conventional
Create a Home Valuation Report for This Property
The Home Valuation Report is an in-depth analysis detailing your home's value as well as a comparison with similar homes in the area
Home Values in the Area
Average Home Value in this Area
Purchase History
| Date | Buyer | Sale Price | Title Company |
|---|---|---|---|
| Monzon Oscar Estuardo Trust | -- | -- | |
| Monzon Oscar E | $225,900 | -- | |
| Hinton Sharon A | $159,900 | -- |
Source: Public Records
Mortgage History
| Date | Status | Borrower | Loan Amount |
|---|---|---|---|
| Previous Owner | Monzon Oscar E | $224,074 | |
| Previous Owner | Hinton Sharon A | $151,900 |
Source: Public Records
Tax History Compared to Growth
Tax History
| Year | Tax Paid | Tax Assessment Tax Assessment Total Assessment is a certain percentage of the fair market value that is determined by local assessors to be the total taxable value of land and additions on the property. | Land | Improvement |
|---|---|---|---|---|
| 2025 | $4,515 | $166,040 | $28,000 | $138,040 |
| 2024 | $4,384 | $153,120 | $38,400 | $114,720 |
| 2023 | $4,384 | $156,440 | $41,600 | $114,840 |
| 2022 | $4,046 | $138,560 | $37,200 | $101,360 |
| 2021 | $3,494 | $109,360 | $26,800 | $82,560 |
| 2020 | $3,519 | $109,360 | $26,800 | $82,560 |
| 2019 | $3,231 | $100,320 | $24,640 | $75,680 |
| 2018 | $3,162 | $97,000 | $24,640 | $72,360 |
| 2016 | $2,979 | $87,520 | $19,600 | $67,920 |
| 2015 | $2,966 | $85,760 | $19,600 | $66,160 |
| 2014 | -- | $85,760 | $19,600 | $66,160 |
Source: Public Records
Map
Nearby Homes
- 2167 Merrymount Dr
- 2265 Wildwood Lake Dr
- 2372 Merrymount Dr Unit 2
- 2370 Cape Courage Way
- 2067 York River Way
- 1924 Sidneys Cove
- 2140 Deer Trail
- 1932 Riverton Dr
- 2140 Wildcat Cliffs Way
- 2061 Wildcat Cliffs Ln
- 2315 Prosperity Way Unit 2
- 1839 Stonebrook Way
- 205 Camden Creek Ct
- 318 Lee Miller Dr
- 83 Russell Rd
- 330 Allatoona Rd
- 327 Lee Miller Dr
- 267 Arbour Way
- 2205 Parliament Dr
- 525 Provence Gate Ln
- 2183 Cape Liberty Dr Unit 40
- 2183 Cape Liberty Dr
- 2173 Cape Liberty Dr Unit 3
- 241 Waterford Cove Dr Unit 3
- 2163 Cape Liberty Dr Unit 4
- 231 Waterford Cove Dr
- 2174 Cape Liberty Dr
- 2002 Little River Dr Unit 1
- 212 Marston Dr
- 2153 Cape Liberty Dr
- 0 Waterford Cove Dr Unit 7105206
- 0 Waterford Cove Dr Unit 7201296
- 0 Waterford Cove Dr Unit 17
- 221 Waterford Cove Dr Unit 3
- 221 Waterford Cove Dr Unit 17
- 2215 Cape Courage Way
- 2205 Cape Courage Way
- 2164 Cape Liberty Dr
- 2225 Cape Courage Way Unit 1
- 261 Waterford Cove Dr