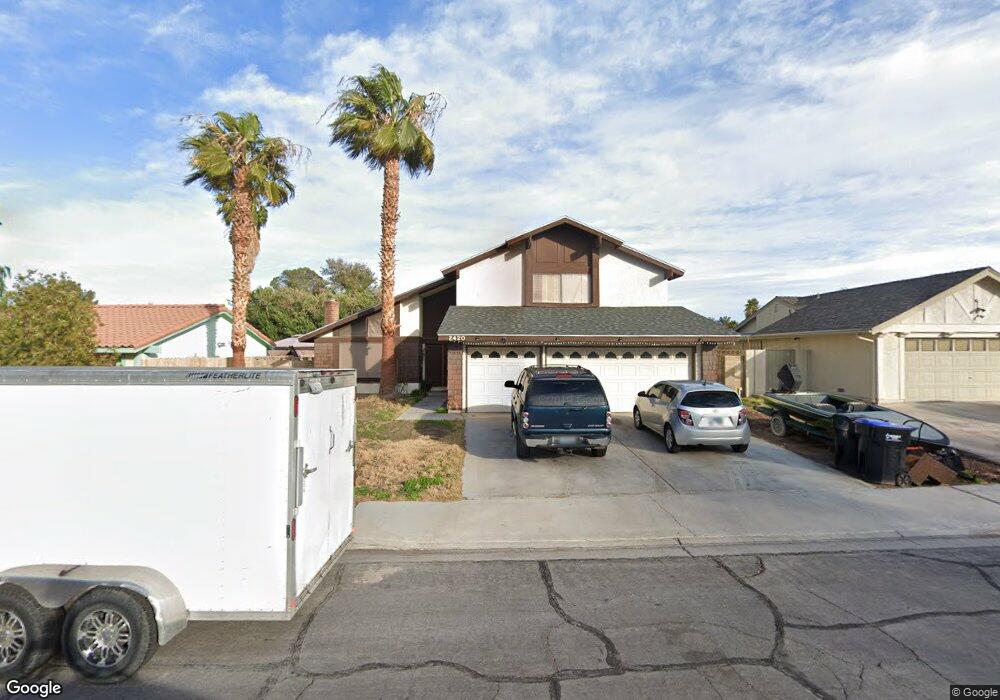
2420 Doherty Way Henderson, NV 89014
Green Valley North NeighborhoodEstimated Value: $525,266 - $598,000
5
Beds
3
Baths
2,552
Sq Ft
$222/Sq Ft
Est. Value
About This Home
This home is located at 2420 Doherty Way, Henderson, NV 89014 and is currently estimated at $565,567, approximately $221 per square foot. 2420 Doherty Way is a home located in Clark County with nearby schools including Estes M Mcdoniel Elementary School, Barbara and Hank Greenspun Junior High School, and Green Valley High School.
Ownership History
Date
Name
Owned For
Owner Type
Purchase Details
Closed on
Nov 23, 2009
Sold by
Singh Alka
Bought by
Hofmann Corey J
Current Estimated Value
Home Financials for this Owner
Home Financials are based on the most recent Mortgage that was taken out on this home.
Original Mortgage
$181,649
Outstanding Balance
$116,913
Interest Rate
4.88%
Mortgage Type
FHA
Estimated Equity
$448,654
Purchase Details
Closed on
Oct 26, 2000
Sold by
Malik Tejwant S
Bought by
Singh Alka
Home Financials for this Owner
Home Financials are based on the most recent Mortgage that was taken out on this home.
Original Mortgage
$171,450
Interest Rate
7.82%
Purchase Details
Closed on
Sep 14, 1999
Sold by
Peot Thomas E and Peot Melva J
Bought by
Peot Thomas E and Peot Melva J
Create a Home Valuation Report for This Property
The Home Valuation Report is an in-depth analysis detailing your home's value as well as a comparison with similar homes in the area
Home Values in the Area
Average Home Value in this Area
Purchase History
| Date | Buyer | Sale Price | Title Company |
|---|---|---|---|
| Hofmann Corey J | $185,000 | Ticor Title Las Vegas | |
| Singh Alka | -- | Old Republic Title Company | |
| Singh Alka | $190,500 | Old Republic Title Company | |
| Peot Thomas E | -- | -- |
Source: Public Records
Mortgage History
| Date | Status | Borrower | Loan Amount |
|---|---|---|---|
| Open | Hofmann Corey J | $181,649 | |
| Previous Owner | Singh Alka | $171,450 |
Source: Public Records
Tax History Compared to Growth
Tax History
| Year | Tax Paid | Tax Assessment Tax Assessment Total Assessment is a certain percentage of the fair market value that is determined by local assessors to be the total taxable value of land and additions on the property. | Land | Improvement |
|---|---|---|---|---|
| 2025 | $2,790 | $99,663 | $44,100 | $55,563 |
| 2024 | $2,584 | $99,663 | $44,100 | $55,563 |
| 2023 | $2,584 | $98,832 | $44,100 | $54,732 |
| 2022 | $2,393 | $87,962 | $36,750 | $51,212 |
| 2021 | $2,216 | $80,799 | $31,150 | $49,649 |
| 2020 | $2,054 | $79,945 | $29,750 | $50,195 |
| 2019 | $1,925 | $75,372 | $25,200 | $50,172 |
| 2018 | $1,837 | $74,278 | $25,200 | $49,078 |
| 2017 | $2,077 | $71,656 | $21,000 | $50,656 |
| 2016 | $1,720 | $66,835 | $15,050 | $51,785 |
| 2015 | $1,716 | $61,288 | $12,950 | $48,338 |
| 2014 | $1,663 | $55,695 | $10,850 | $44,845 |
Source: Public Records
Map
Nearby Homes
- 2472 Marlene Way
- 615 Cervantes Dr
- 2488 Marlene Way
- 628 Cervantes Dr
- 666 Cervantes Dr
- 675 Cervantes Dr
- 639 Pepper Tree Cir Unit A
- 2504 Balintore Ct
- 2841 Glendevon Cir
- 764 Apple Tree Ct
- 2248 Marlboro Dr
- 735 Apple Tree Ct
- 1818 Somersby Way
- 1979 Cutlass Dr Unit 72
- 1807 Rapier Dr Unit 151
- 2520 Kilmaron Cir
- 451 Indigo Springs St
- 3006 La Mesa Dr
- 439 Indigo Springs St
- 2050 W Warm Springs Rd Unit 3624
- 2422 Doherty Way
- 2418 Doherty Way
- 2466 Marlene Way
- 2464 Marlene Way
- 2416 Doherty Way
- 2468 Marlene Way
- 2424 Doherty Way
- 2421 Doherty Way
- 2423 Doherty Way
- 2419 Doherty Way
- 2470 Marlene Way
- 2460 Marlene Way
- 2414 Doherty Way
- 2426 Doherty Way Unit 1
- 2417 Doherty Way
- 2458 Marlene Way
- 2422 Marlene Way
- 2465 Marlene Way
- 2424 Marlene Way