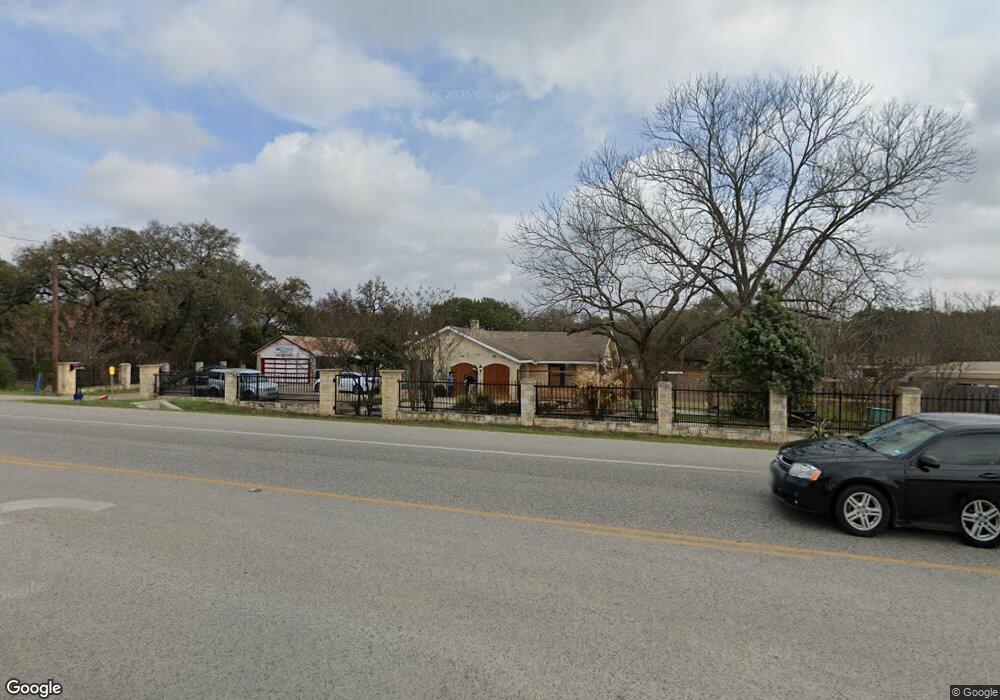
24202 Boerne Stage Rd San Antonio, TX 78255
Estimated Value: $259,110 - $2,100,000
3
Beds
1
Bath
1,088
Sq Ft
$694/Sq Ft
Est. Value
About This Home
This home is located at 24202 Boerne Stage Rd, San Antonio, TX 78255 and is currently estimated at $755,528, approximately $694 per square foot. 24202 Boerne Stage Rd is a home located in Bexar County with nearby schools including Aue Elementary School, Rawlinson Middle School, and Clark High School.
Ownership History
Date
Name
Owned For
Owner Type
Purchase Details
Closed on
Mar 23, 2018
Sold by
Nguyen Samloi
Bought by
Urbrella Mns Properties Llc
Current Estimated Value
Home Financials for this Owner
Home Financials are based on the most recent Mortgage that was taken out on this home.
Original Mortgage
$325,000
Outstanding Balance
$278,102
Interest Rate
4.32%
Estimated Equity
$477,426
Purchase Details
Closed on
Jan 11, 2011
Sold by
Nguyen Samloi
Bought by
Bexar County Texas
Purchase Details
Closed on
Aug 26, 2008
Sold by
Hand Almeda and Zunker Margaret Sue Hand
Bought by
Nguyen Samloi
Home Financials for this Owner
Home Financials are based on the most recent Mortgage that was taken out on this home.
Original Mortgage
$111,200
Interest Rate
6.54%
Mortgage Type
Purchase Money Mortgage
Create a Home Valuation Report for This Property
The Home Valuation Report is an in-depth analysis detailing your home's value as well as a comparison with similar homes in the area
Home Values in the Area
Average Home Value in this Area
Purchase History
| Date | Buyer | Sale Price | Title Company |
|---|---|---|---|
| Urbrella Mns Properties Llc | -- | None Available | |
| Bexar County Texas | $1,400 | None Available | |
| Nguyen Samloi | -- | None Available |
Source: Public Records
Mortgage History
| Date | Status | Borrower | Loan Amount |
|---|---|---|---|
| Open | Urbrella Mns Properties Llc | $325,000 | |
| Previous Owner | Nguyen Samloi | $111,200 |
Source: Public Records
Tax History Compared to Growth
Tax History
| Year | Tax Paid | Tax Assessment Tax Assessment Total Assessment is a certain percentage of the fair market value that is determined by local assessors to be the total taxable value of land and additions on the property. | Land | Improvement |
|---|---|---|---|---|
| 2025 | $3,173 | $175,000 | $123,360 | $51,640 |
| 2024 | $3,173 | $175,000 | $114,870 | $60,130 |
| 2023 | $3,173 | $175,000 | $114,870 | $60,130 |
| 2022 | $4,111 | $171,000 | $93,280 | $77,720 |
| 2021 | $3,523 | $171,000 | $84,800 | $86,200 |
| 2020 | $3,487 | $165,660 | $81,540 | $84,120 |
| 2019 | $3,563 | $163,680 | $79,560 | $84,120 |
| 2018 | $3,584 | $164,630 | $79,560 | $85,070 |
| 2017 | $3,479 | $159,270 | $79,560 | $79,710 |
| 2016 | $3,494 | $159,990 | $79,560 | $80,430 |
| 2015 | $2,813 | $149,699 | $79,560 | $80,710 |
| 2014 | $2,813 | $136,090 | $0 | $0 |
Source: Public Records
Map
Nearby Homes
- 24406 Treaty Creek
- 8019 Jalane Oaks
- 24406 Flint Creek
- 24423 Elise Falls
- 24442 Buck Creek
- 8226 Piney Wood Run
- 14728 Childress Falls
- 8306 Piney Wood Run
- 24159 Boerne Stage Rd
- 8343 Bordeaux Bay
- 8347 Piney Wood Run
- 8219 Wayside Creek
- 8355 Piney Wood Run
- 24434 Brazos Stage
- 8506 Driftwood Hill
- 7811 Midnight Stage
- 8110 Cooper Corral Cir
- 24831 Cloudy Creek
- 24710 Cloudy Creek
- 24003 Verde River
- 24196 Boerne Stage Rd
- 24194 Boerne Stage Rd
- 24214 Palo Duro Peak
- 24210 Palo Duro Peak
- 24219 Palo Duro Peak
- 24206 Palo Duro Peak
- 8050 Maddie Ln
- 8054 Maddie Ln
- 8046 Maddie Ln
- 8042 Maddie Ln
- 24215 Palo Duro Peak
- 24188 Boerne Stage Rd
- 24202 Palo Duro Peak
- 8058 Maddie Ln
- 8038 Maddie Ln
- 24207 Palo Duro Peak
- 24192 Boerne Stage Rd
- 8034 Maddie Ln
- 8062 Maddie Ln
- 24203 Palo Duro Peak