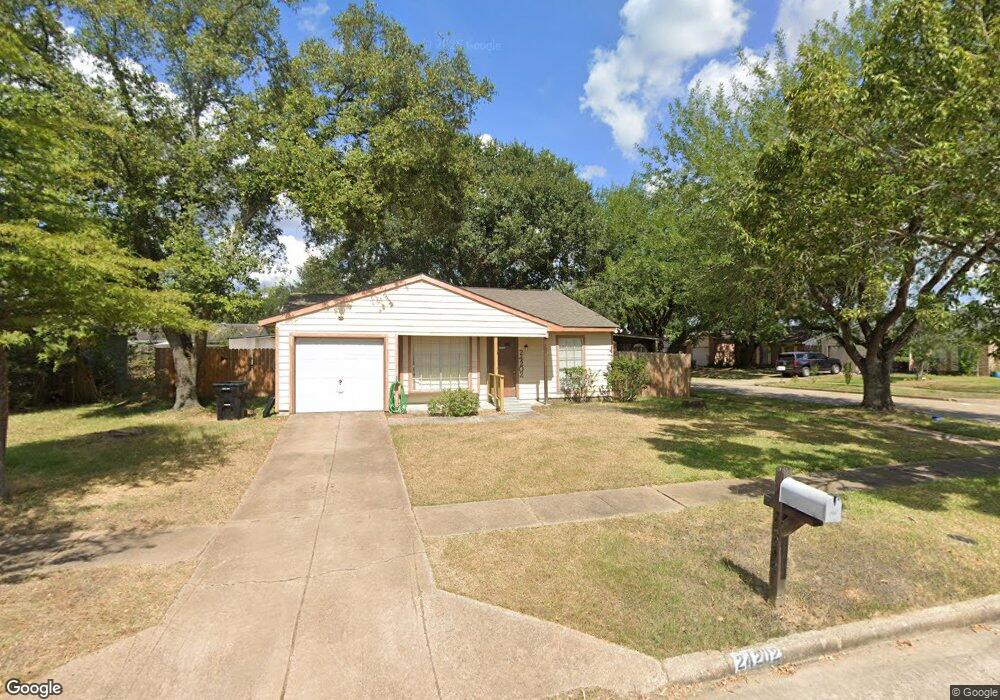
24202 Jumping Jay Dr Hockley, TX 77447
Hockley NeighborhoodEstimated Value: $158,697 - $169,000
2
Beds
1
Bath
881
Sq Ft
$188/Sq Ft
Est. Value
About This Home
This home is located at 24202 Jumping Jay Dr, Hockley, TX 77447 and is currently estimated at $165,674, approximately $188 per square foot. 24202 Jumping Jay Dr is a home located in Harris County with nearby schools including Roberts Road Elementary School, Waller Junior High School, and Waller High School.
Ownership History
Date
Name
Owned For
Owner Type
Purchase Details
Closed on
Sep 2, 2008
Sold by
Hud
Bought by
Ray Obdulia P
Current Estimated Value
Purchase Details
Closed on
Sep 12, 2007
Sold by
Us Bank Na
Bought by
Hud
Purchase Details
Closed on
Aug 7, 2007
Sold by
Williams Dasareeta P and Williams Christopher Lynn
Bought by
Us Bank Na
Purchase Details
Closed on
Sep 25, 2001
Sold by
Richards Bruce Allan and Pariza Mary Elizabeth
Bought by
Williams Dasareeta P
Home Financials for this Owner
Home Financials are based on the most recent Mortgage that was taken out on this home.
Original Mortgage
$49,614
Interest Rate
6.88%
Mortgage Type
FHA
Purchase Details
Closed on
Dec 2, 2000
Sold by
Queen James S and Queen Mary A
Bought by
Richards Bruce Allan and Pariza Mary Elizabeth
Create a Home Valuation Report for This Property
The Home Valuation Report is an in-depth analysis detailing your home's value as well as a comparison with similar homes in the area
Home Values in the Area
Average Home Value in this Area
Purchase History
| Date | Buyer | Sale Price | Title Company |
|---|---|---|---|
| Ray Obdulia P | -- | None Available | |
| Hud | -- | None Available | |
| Us Bank Na | $53,053 | None Available | |
| Williams Dasareeta P | -- | Alamo Title 17 | |
| Richards Bruce Allan | -- | -- |
Source: Public Records
Mortgage History
| Date | Status | Borrower | Loan Amount |
|---|---|---|---|
| Previous Owner | Williams Dasareeta P | $49,614 |
Source: Public Records
Tax History Compared to Growth
Tax History
| Year | Tax Paid | Tax Assessment Tax Assessment Total Assessment is a certain percentage of the fair market value that is determined by local assessors to be the total taxable value of land and additions on the property. | Land | Improvement |
|---|---|---|---|---|
| 2025 | $3,363 | $136,592 | $34,939 | $101,653 |
| 2024 | $3,363 | $135,300 | $34,939 | $100,361 |
| 2023 | $3,363 | $134,391 | $34,939 | $99,452 |
| 2022 | $3,204 | $119,988 | $34,939 | $85,049 |
| 2021 | $2,712 | $97,000 | $28,586 | $68,414 |
| 2020 | $2,609 | $90,387 | $26,998 | $63,389 |
| 2019 | $2,424 | $81,200 | $22,234 | $58,966 |
| 2018 | $528 | $63,170 | $22,234 | $40,936 |
| 2017 | $1,867 | $63,170 | $22,234 | $40,936 |
| 2016 | $1,842 | $62,318 | $22,234 | $40,084 |
| 2015 | $701 | $58,000 | $15,246 | $42,754 |
| 2014 | $701 | $35,000 | $15,246 | $19,754 |
Source: Public Records
Map
Nearby Homes
- 17506 Bullis Gap Dr
- 24310 Rockin Seven Dr
- 24402 Jumping Jay Dr
- 24039 Rockin Seven Dr
- 24211 Four Sixes Ln
- 24303 Four Sixes Ln
- 24414 Broken Bow Ln
- 24231 Wild Horse Ln
- 17607 Lavender Blossom Ln
- 17419 Lavender Blossom Ln
- 17423 Lavender Blossom Ln
- 17503 Lavender Blossom Ln
- 2076 Stallion Lakes Ave
- 24402 Bar Kay Ln
- 32115 Waterlily View Ct
- 24503 Wild Horse Ln
- 32103 Sweet Pea Meadows Dr
- 0 Lazy Kay Ln
- 32114 Sweet Pea Meadows Dr
- Tyler Plan at Dellrose
- 24206 Jumping Jay Dr
- 24203 Beef Canyon Dr
- 24207 Beef Canyon Dr
- 24210 Jumping Jay Dr
- 24211 Beef Canyon Dr
- 24203 Jumping Jay Dr
- 24207 Jumping Jay Dr
- 24214 Jumping Jay Dr
- 17526 Bullis Gap Dr
- 17522 Bullis Gap Dr
- 24211 Jumping Jay Dr
- 24215 Beef Canyon Dr
- 17518 Bullis Gap Dr
- 17530 Bullis Gap Dr
- 17514 Bullis Gap Dr
- 24218 Jumping Jay Dr
- 24215 Jumping Jay Dr
- 17510 Bullis Gap Dr
- 24219 Beef Canyon Dr
- 24202 Beef Canyon Dr