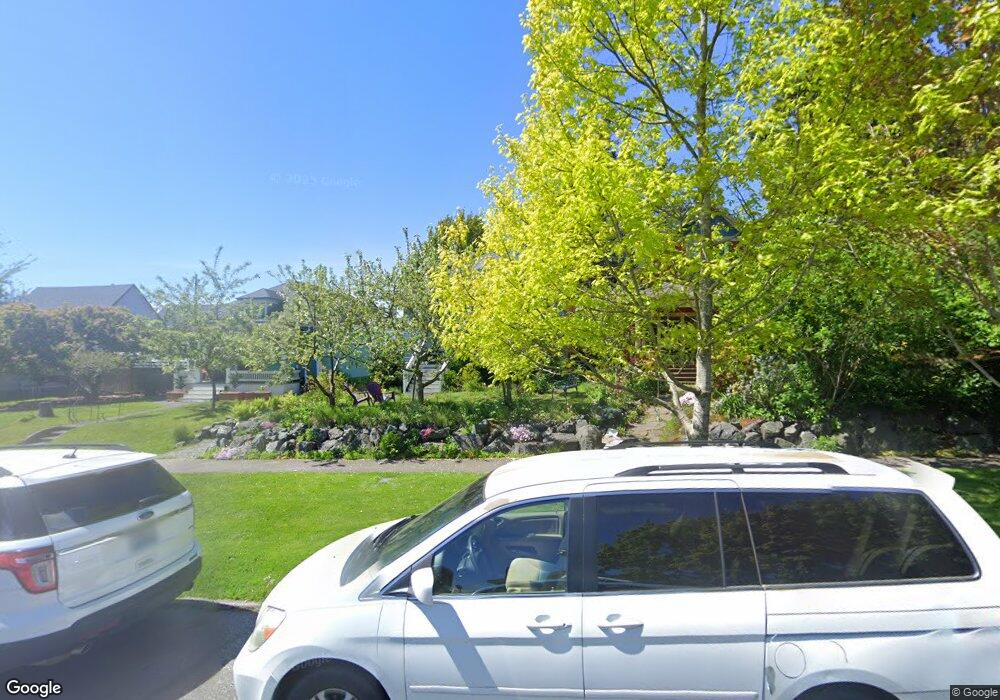
2421 Ellis St Bellingham, WA 98225
Sunnyland NeighborhoodEstimated Value: $682,000 - $787,000
3
Beds
2
Baths
1,788
Sq Ft
$408/Sq Ft
Est. Value
About This Home
This home is located at 2421 Ellis St, Bellingham, WA 98225 and is currently estimated at $729,510, approximately $408 per square foot. 2421 Ellis St is a home located in Whatcom County with nearby schools including Parkview Elementary School, Whatcom Middle School, and Bellingham High School.
Ownership History
Date
Name
Owned For
Owner Type
Purchase Details
Closed on
Aug 17, 2011
Sold by
Koons Susan Ellen
Bought by
Lingbloom Carl Thomas and Lingbloom Morgan
Current Estimated Value
Home Financials for this Owner
Home Financials are based on the most recent Mortgage that was taken out on this home.
Original Mortgage
$207,600
Outstanding Balance
$143,001
Interest Rate
4.46%
Mortgage Type
New Conventional
Estimated Equity
$586,509
Create a Home Valuation Report for This Property
The Home Valuation Report is an in-depth analysis detailing your home's value as well as a comparison with similar homes in the area
Home Values in the Area
Average Home Value in this Area
Purchase History
| Date | Buyer | Sale Price | Title Company |
|---|---|---|---|
| Lingbloom Carl Thomas | $259,780 | First American Title Ins |
Source: Public Records
Mortgage History
| Date | Status | Borrower | Loan Amount |
|---|---|---|---|
| Open | Lingbloom Carl Thomas | $207,600 |
Source: Public Records
Tax History Compared to Growth
Tax History
| Year | Tax Paid | Tax Assessment Tax Assessment Total Assessment is a certain percentage of the fair market value that is determined by local assessors to be the total taxable value of land and additions on the property. | Land | Improvement |
|---|---|---|---|---|
| 2024 | $5,560 | $696,776 | $246,304 | $450,472 |
| 2023 | $5,560 | $714,473 | $252,560 | $461,913 |
| 2022 | $3,815 | $517,459 | $217,728 | $299,731 |
| 2021 | $3,742 | $410,682 | $172,800 | $237,882 |
| 2020 | $3,514 | $380,261 | $160,000 | $220,261 |
| 2019 | $3,146 | $345,121 | $143,078 | $202,043 |
| 2018 | $3,168 | $309,797 | $128,458 | $181,339 |
| 2017 | $2,732 | $266,726 | $110,596 | $156,130 |
| 2016 | $2,391 | $240,394 | $99,244 | $141,150 |
| 2015 | $2,344 | $219,006 | $90,644 | $128,362 |
| 2014 | -- | $207,786 | $86,000 | $121,786 |
| 2013 | -- | $212,494 | $86,100 | $126,394 |
Source: Public Records
Map
Nearby Homes