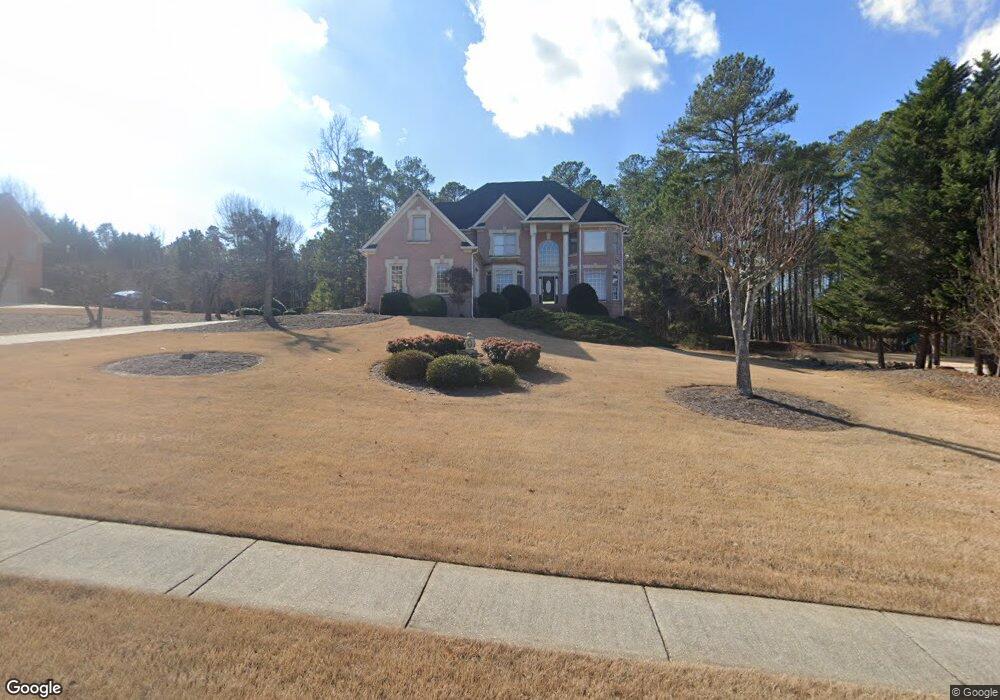
2421 Fairhaven Cove NE Unit 2 Conyers, GA 30012
Estimated Value: $497,000 - $578,000
6
Beds
8
Baths
3,802
Sq Ft
$142/Sq Ft
Est. Value
About This Home
This home is located at 2421 Fairhaven Cove NE Unit 2, Conyers, GA 30012 and is currently estimated at $540,835, approximately $142 per square foot. 2421 Fairhaven Cove NE Unit 2 is a home located in Rockdale County with nearby schools including Hightower Trail Elementary School, Conyers Middle School, and Rockdale County High School.
Ownership History
Date
Name
Owned For
Owner Type
Purchase Details
Closed on
Aug 14, 2019
Sold by
Webster Danetta L
Bought by
Webster Gregory A and Webster Danetta L
Current Estimated Value
Purchase Details
Closed on
Jun 3, 2005
Sold by
Nwiloh Pamela I and Nwiloh Jonathan
Bought by
Webster Danetta
Home Financials for this Owner
Home Financials are based on the most recent Mortgage that was taken out on this home.
Original Mortgage
$79,000
Interest Rate
5.17%
Mortgage Type
Unknown
Purchase Details
Closed on
Apr 14, 1999
Sold by
D & F Const Inc
Bought by
Nwiloh Jonathan and Nwiloh Pamela I
Home Financials for this Owner
Home Financials are based on the most recent Mortgage that was taken out on this home.
Original Mortgage
$256,000
Interest Rate
7.08%
Mortgage Type
New Conventional
Create a Home Valuation Report for This Property
The Home Valuation Report is an in-depth analysis detailing your home's value as well as a comparison with similar homes in the area
Home Values in the Area
Average Home Value in this Area
Purchase History
| Date | Buyer | Sale Price | Title Company |
|---|---|---|---|
| Webster Gregory A | -- | -- | |
| Webster Danetta | $395,000 | -- | |
| Nwiloh Jonathan | $332,200 | -- |
Source: Public Records
Mortgage History
| Date | Status | Borrower | Loan Amount |
|---|---|---|---|
| Previous Owner | Webster Danetta | $79,000 | |
| Previous Owner | Webster Danetta | $316,000 | |
| Previous Owner | Nwiloh Jonathan | $256,000 |
Source: Public Records
Tax History Compared to Growth
Tax History
| Year | Tax Paid | Tax Assessment Tax Assessment Total Assessment is a certain percentage of the fair market value that is determined by local assessors to be the total taxable value of land and additions on the property. | Land | Improvement |
|---|---|---|---|---|
| 2024 | $6,334 | $252,480 | $53,600 | $198,880 |
| 2023 | $4,879 | $204,200 | $38,960 | $165,240 |
| 2022 | $4,122 | $170,280 | $33,840 | $136,440 |
| 2021 | $3,389 | $132,920 | $29,320 | $103,600 |
| 2020 | $3,031 | $115,280 | $24,000 | $91,280 |
| 2019 | $3,186 | $117,880 | $18,000 | $99,880 |
| 2018 | $3,207 | $117,880 | $18,000 | $99,880 |
| 2017 | $3,009 | $110,200 | $18,000 | $92,200 |
| 2016 | $2,778 | $110,200 | $18,000 | $92,200 |
| 2015 | $3,017 | $118,240 | $18,000 | $100,240 |
| 2014 | $2,691 | $118,240 | $18,000 | $100,240 |
| 2013 | -- | $114,920 | $20,000 | $94,920 |
Source: Public Records
Map
Nearby Homes
- 3150 Haverhill Cove NE Unit 2
- 3070 N Tower Way NE
- 0 E Hightower Trail
- 00 E Hightower Trail
- 3449 Highway 138 NE
- 3295 Highway 138 NE
- 0 Salem Church Rd NE Unit 10167606
- 0 Stream View Dr Unit LOT 19
- 2827 Highway 138 NE
- 3058 White Rd NE
- 2528 Stream View Dr
- 2316 Hi Roc Cir NE
- 2643 Twin Oaks Dr NE
- 2635 Twin Oaks Dr NE
- 2331 Leafway Trail NE
- 2141 Arlin St NE
- 3250 Miller Bottom Rd
- 2737 Bethel Rd NE
- 2531 Hill Cir NE
- 2040 Costley Mill Rd NE
- 2411 Fairhaven Cove NE
- 2431 Fairhaven Cove NE
- 2401 Fairhaven Cove NE
- 2441 Fairhaven Cove NE
- 2420 Fairhaven Cove NE
- 2400 Fairhaven Cove NE
- 2391 Fairhaven Cove NE
- 2391 Fairhaven Cove NE Unit 2
- 3201 Marblehead Cove NE Unit 2
- 3101 Haverhill Cove NE Unit 376
- 3101 Haverhill Cove NE
- 3210 Marblehead Cove NE
- 0 Marblehead Cove NE Unit 7071756
- 0 Marblehead Cove NE Unit 8755529
- 2450 Fairhaven Cove NE Unit 2
- 2381 Fairhaven Cove NE
- 2460 Fairhaven Cove NE
- 2460 Fairhaven Cove NE Unit 2
- 3111 Haverhill Cove NE Unit 2
- 3211 Marblehead Cove NE