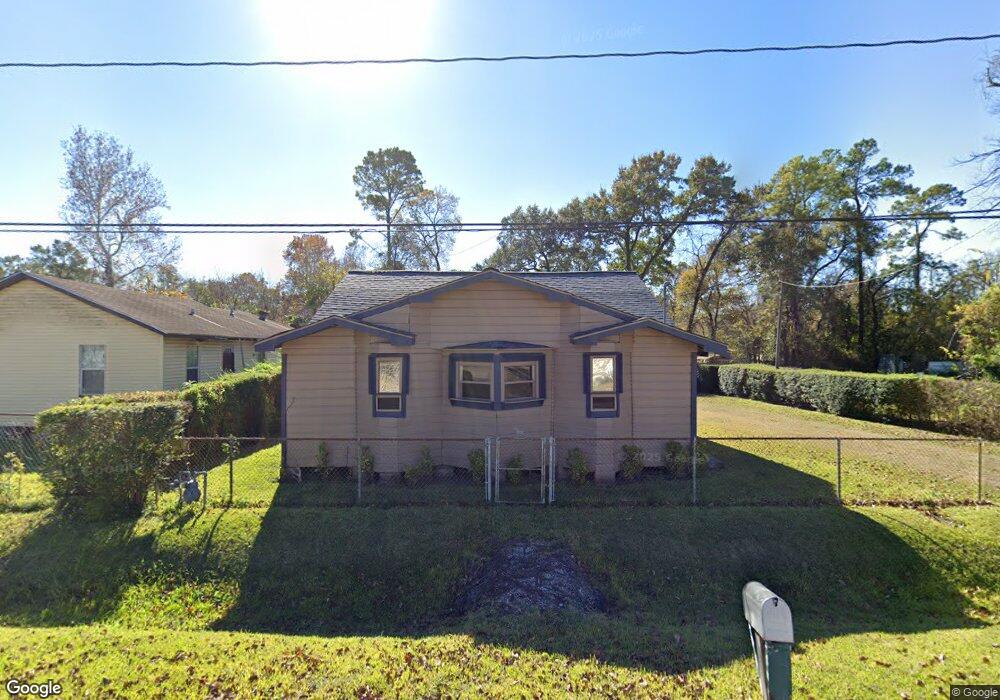
2421 Glen Ave Houston, TX 77088
Acres Homes NeighborhoodEstimated Value: $129,000 - $189,000
2
Beds
1
Bath
878
Sq Ft
$183/Sq Ft
Est. Value
About This Home
This home is located at 2421 Glen Ave, Houston, TX 77088 and is currently estimated at $160,749, approximately $183 per square foot. 2421 Glen Ave is a home located in Harris County with nearby schools including Reece Academy, Anderson Academy, and Drew Academy.
Ownership History
Date
Name
Owned For
Owner Type
Purchase Details
Closed on
Apr 23, 2013
Sold by
Wiley Tommie Sims
Bought by
Mcarthur Wiley Douglas
Current Estimated Value
Purchase Details
Closed on
Dec 1, 2005
Sold by
Sims Betty Ann and Joseph Betty Ann Sims
Bought by
Joseph Willie and Joseph Betty Ann Simis
Home Financials for this Owner
Home Financials are based on the most recent Mortgage that was taken out on this home.
Original Mortgage
$45,500
Interest Rate
6.3%
Mortgage Type
New Conventional
Purchase Details
Closed on
Apr 14, 2004
Sold by
Hunter Cathlyn and Cole Cathlyn
Bought by
Cole Cathlyn and Cole Reginald
Purchase Details
Closed on
Nov 1, 2001
Sold by
Hunter Cathlyn
Bought by
Hunter Cathlyn
Purchase Details
Closed on
Nov 6, 1996
Sold by
Jackson Charles
Bought by
Sims Betty Ann
Purchase Details
Closed on
Jul 11, 1994
Sold by
Martin Leonard E
Bought by
Isbell Elois J
Purchase Details
Closed on
Mar 8, 1994
Sold by
Martin Leonard E
Bought by
Jackson Charles
Create a Home Valuation Report for This Property
The Home Valuation Report is an in-depth analysis detailing your home's value as well as a comparison with similar homes in the area
Home Values in the Area
Average Home Value in this Area
Purchase History
| Date | Buyer | Sale Price | Title Company |
|---|---|---|---|
| Mcarthur Wiley Douglas | -- | None Available | |
| Joseph Willie | -- | Netco | |
| Cole Cathlyn | -- | American Title Co | |
| Hunter Cathlyn | -- | -- | |
| Sims Betty Ann | -- | -- | |
| Isbell Elois J | -- | -- | |
| Jackson Charles | -- | -- |
Source: Public Records
Mortgage History
| Date | Status | Borrower | Loan Amount |
|---|---|---|---|
| Previous Owner | Joseph Willie | $45,500 |
Source: Public Records
Tax History Compared to Growth
Tax History
| Year | Tax Paid | Tax Assessment Tax Assessment Total Assessment is a certain percentage of the fair market value that is determined by local assessors to be the total taxable value of land and additions on the property. | Land | Improvement |
|---|---|---|---|---|
| 2025 | $904 | $150,474 | $90,034 | $60,440 |
| 2024 | $904 | $144,645 | $93,751 | $50,894 |
| 2023 | $904 | $143,359 | $79,296 | $64,063 |
| 2022 | $1,790 | $110,833 | $57,820 | $53,013 |
| 2021 | $1,704 | $90,268 | $41,300 | $48,968 |
| 2020 | $1,628 | $81,750 | $33,040 | $48,710 |
| 2019 | $1,255 | $56,666 | $22,715 | $33,951 |
| 2018 | $233 | $52,216 | $16,520 | $35,696 |
| 2017 | $994 | $52,216 | $16,520 | $35,696 |
| 2016 | $904 | $46,425 | $14,868 | $31,557 |
| 2015 | $480 | $36,599 | $12,803 | $23,796 |
| 2014 | $480 | $28,155 | $12,803 | $15,352 |
Source: Public Records
Map
Nearby Homes
- 2456 Walcott Ln
- 2407 Dolly Wright St
- 7413 Easter St
- 5815 Morehouse Ln
- 2429 Calvin Ave
- 2531 Walcott Ln
- 2409 Wall St
- 0 Dolly Wright St Unit 24865287
- 0 Emma Lou St
- 7502 Carver Rd Unit A
- 7504 Carver Rd Unit D
- 5734 White Magnolia St
- 2415 W Little York Rd Unit D
- 8112 Carver Rd
- 2448 Areba St
- 7513 Charlie St
- 0 Dyer St
- 7050 Inwood Park Dr
- 7050 Inwood Park Dr Unit 113
- 2604 Areba St
- 2417 Glen Ave
- 2413 Glen Ln Unit D
- 2413 Glen Ln Unit C
- 2413 Glen Ln Unit B
- 2413 Glen Ln Unit A
- 2429 Glen Ave
- 2422 Walcott Ln
- 2426 Walcott Ln
- 2430 Walcott Ln
- 2422 Glen Ave
- 2418 Glen Ave
- 2426 Glen Ave
- 2434 Walcott Ln
- 2430 Glen Ave
- 2405 Glen Ave
- 2437 Glen Ave
- 2438 Walcott Ln
- 2413 Dolly Wright St
- 2425 Dolly Wright St
- 7209 Carver Rd Unit B