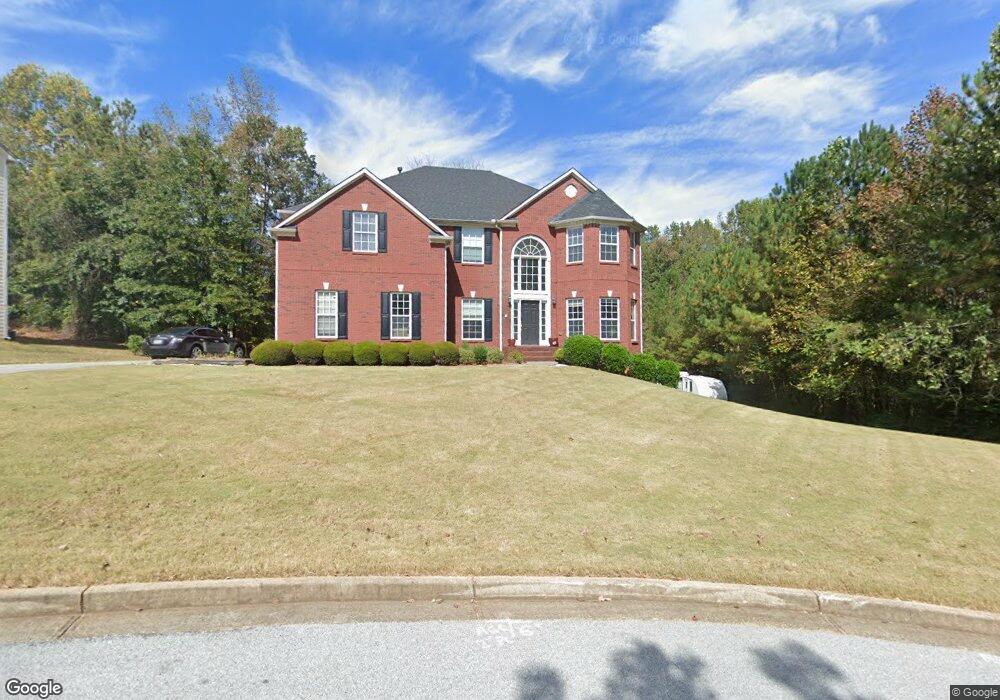
2421 Hyde Park Ct Conyers, GA 30013
Estimated Value: $398,243 - $474,000
4
Beds
3
Baths
2,972
Sq Ft
$147/Sq Ft
Est. Value
About This Home
This home is located at 2421 Hyde Park Ct, Conyers, GA 30013 and is currently estimated at $438,061, approximately $147 per square foot. 2421 Hyde Park Ct is a home located in Rockdale County with nearby schools including Honey Creek Elementary School, Memorial Middle School, and Salem High School.
Ownership History
Date
Name
Owned For
Owner Type
Purchase Details
Closed on
Mar 24, 2016
Sold by
Parrish Rodinol
Bought by
Parrish Cordilia
Current Estimated Value
Purchase Details
Closed on
Aug 31, 2010
Sold by
Cwalt Inc Trust 2005-23Cb
Bought by
Parrish Rodinol and Parrish Cordilia
Home Financials for this Owner
Home Financials are based on the most recent Mortgage that was taken out on this home.
Original Mortgage
$173,661
Interest Rate
5.12%
Mortgage Type
FHA
Purchase Details
Closed on
Dec 1, 2009
Sold by
Burford Walter W
Bought by
Cwalt Inc Trust 2005-23Cb
Purchase Details
Closed on
Mar 25, 2005
Sold by
The Ryland Grp Inc
Bought by
Burford Walter W
Home Financials for this Owner
Home Financials are based on the most recent Mortgage that was taken out on this home.
Original Mortgage
$301,160
Interest Rate
5.62%
Mortgage Type
New Conventional
Purchase Details
Closed on
Nov 24, 2004
Sold by
Five Star Props Gp
Bought by
The Ryland Grp Inc
Create a Home Valuation Report for This Property
The Home Valuation Report is an in-depth analysis detailing your home's value as well as a comparison with similar homes in the area
Home Values in the Area
Average Home Value in this Area
Purchase History
| Date | Buyer | Sale Price | Title Company |
|---|---|---|---|
| Parrish Cordilia | -- | -- | |
| Parrish Rodinol | $176,000 | -- | |
| Cwalt Inc Trust 2005-23Cb | $159,857 | -- | |
| Burford Walter W | $317,100 | -- | |
| The Ryland Grp Inc | $121,000 | -- |
Source: Public Records
Mortgage History
| Date | Status | Borrower | Loan Amount |
|---|---|---|---|
| Previous Owner | Parrish Rodinol | $173,661 | |
| Previous Owner | Burford Walter W | $301,160 |
Source: Public Records
Tax History Compared to Growth
Tax History
| Year | Tax Paid | Tax Assessment Tax Assessment Total Assessment is a certain percentage of the fair market value that is determined by local assessors to be the total taxable value of land and additions on the property. | Land | Improvement |
|---|---|---|---|---|
| 2024 | $4,140 | $164,960 | $32,520 | $132,440 |
| 2023 | $4,274 | $175,480 | $36,080 | $139,400 |
| 2022 | $3,748 | $155,000 | $31,880 | $123,120 |
| 2021 | $2,977 | $117,240 | $23,800 | $93,440 |
| 2020 | $3,030 | $114,640 | $21,200 | $93,440 |
| 2019 | $2,189 | $84,880 | $10,680 | $74,200 |
| 2018 | $2,203 | $84,880 | $10,680 | $74,200 |
| 2017 | $2,356 | $88,800 | $10,680 | $78,120 |
| 2016 | $2,177 | $88,800 | $10,680 | $78,120 |
| 2015 | $1,815 | $76,160 | $9,760 | $66,400 |
| 2014 | $1,942 | $88,480 | $10,360 | $78,120 |
| 2013 | -- | $105,680 | $15,200 | $90,480 |
Source: Public Records
Map
Nearby Homes
- 2513 Riverton Dr
- 2405 Brisbane Dr
- 464 Reflection Creek Dr
- 440 Reflection Creek Dr
- 452 Reflection Creek Dr
- 3106 Brians Creek Dr SE
- 2304 Northglenn Ct
- 1270 Peeks Ford Rd SE
- 1388 Fall River Dr
- 3113 Brians Creek Dr SE
- 3766 Windy Hill Dr SE Unit 2
- 1406 Windy Ridge Ct SE
- 3180 Highway 20 SE
- 1709 Grove Ct SE
- 1141 Carillon Dr SE
- 1613 Brolington Ct
- 3205 Haleys Way SE
- 2417 Hyde Park Ct
- 2140 Torbay Dr
- 2413 Hyde Park Ct Unit 2
- 2420 Hyde Park Ct Unit 2
- 2416 Hyde Park Ct
- 2136 Torbay Dr
- 2424 Hyde Park Ct Unit 2
- 2409 Hyde Park Ct Unit 2
- 2412 Hyde Park Ct
- 0 Hyde Park Ct Unit 7416799
- 0 Hyde Park Ct Unit 7140716
- 0 Hyde Park Ct Unit 8326062
- 0 Hyde Park Ct
- 2141 Torbay Dr Unit 2
- 1908 Enfield Ct
- 2132 Torbay Dr Unit 2
- 2408 Hyde Park Ct
- 2523 Riverton Dr
- 2137 Torbay Dr Unit 2
- 1566 Montauk Point Unit 1