Estimated Value: $464,214 - $505,000
4
Beds
3
Baths
2,920
Sq Ft
$167/Sq Ft
Est. Value
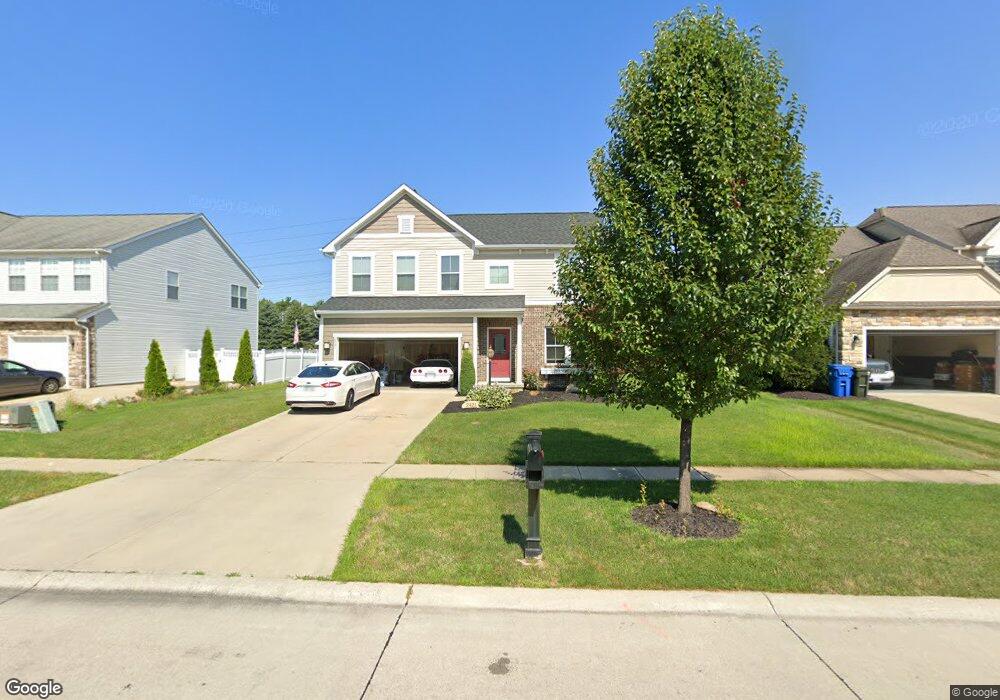
About This Home
This home is located at 2421 Muirwood Rd, Avon, OH 44011 and is currently estimated at $488,804, approximately $167 per square foot. 2421 Muirwood Rd is a home located in Lorain County with nearby schools including Avon Heritage South Elementary School, Avon East Elementary School, and Avon Middle School.
Ownership History
Date
Name
Owned For
Owner Type
Purchase Details
Closed on
Jan 24, 2012
Sold by
Nvr Inc
Bought by
Shmelter Mark D
Current Estimated Value
Home Financials for this Owner
Home Financials are based on the most recent Mortgage that was taken out on this home.
Original Mortgage
$207,555
Outstanding Balance
$140,719
Interest Rate
3.75%
Mortgage Type
FHA
Estimated Equity
$348,085
Purchase Details
Closed on
Dec 28, 2010
Sold by
Arizona Homes At Stonebridge Llc
Bought by
Nvr Inc and Ryan Homes
Purchase Details
Closed on
Sep 20, 2006
Sold by
King James Homes At Stonebridge Llc
Bought by
Stonebridge Village Of Kj Residential Ll
Purchase Details
Closed on
Aug 11, 2004
Sold by
Stonebridge Village Of Kj Residential Ll
Bought by
King James Homes At Stonebridge Llc
Create a Home Valuation Report for This Property
The Home Valuation Report is an in-depth analysis detailing your home's value as well as a comparison with similar homes in the area
Home Values in the Area
Average Home Value in this Area
Purchase History
| Date | Buyer | Sale Price | Title Company |
|---|---|---|---|
| Shmelter Mark D | $221,600 | Nvr Title Agency Llc | |
| Nvr Inc | $172,000 | Nvr Title Agency Llc | |
| Stonebridge Village Of Kj Residential Ll | -- | None Available | |
| King James Homes At Stonebridge Llc | $1,292,000 | Landamerica Title Ins Corp |
Source: Public Records
Mortgage History
| Date | Status | Borrower | Loan Amount |
|---|---|---|---|
| Open | Shmelter Mark D | $207,555 | |
| Closed | King James Homes At Stonebridge Llc | $0 | |
| Closed | King James Homes At Stonebridge Llc | $893,000 |
Source: Public Records
Tax History Compared to Growth
Tax History
| Year | Tax Paid | Tax Assessment Tax Assessment Total Assessment is a certain percentage of the fair market value that is determined by local assessors to be the total taxable value of land and additions on the property. | Land | Improvement |
|---|---|---|---|---|
| 2024 | $5,936 | $120,747 | $30,555 | $90,192 |
| 2023 | $5,457 | $98,648 | $23,412 | $75,236 |
| 2022 | $5,406 | $98,648 | $23,412 | $75,236 |
| 2021 | $5,417 | $98,648 | $23,412 | $75,236 |
| 2020 | $5,280 | $90,260 | $21,420 | $68,840 |
| 2019 | $5,172 | $90,260 | $21,420 | $68,840 |
| 2018 | $4,831 | $90,260 | $21,420 | $68,840 |
| 2017 | $4,871 | $85,450 | $19,720 | $65,730 |
| 2016 | $4,927 | $85,450 | $19,720 | $65,730 |
| 2015 | $4,976 | $85,450 | $19,720 | $65,730 |
| 2014 | $4,336 | $75,090 | $17,330 | $57,760 |
| 2013 | $4,360 | $75,090 | $17,330 | $57,760 |
Source: Public Records
Map
Nearby Homes
- 38455 Foxglen Ave
- 2409 Quail Hollow
- 2424 Roxboro St
- 38754 Renwood Ave
- 38756 Renwood Ave
- 0 Springfield Dr
- 1129 Windmill Way N
- 37826 Briar Lakes Dr
- 37658 Lake Dr
- 2244 Candlewood Dr
- 2463 Candlewood Dr
- 2121 Oakwood Ct Unit 8B
- 3292 Fairview Dr
- 5401 Hawks Nest Cir
- 1951 Sandalwood Dr
- 1872 Candlewood Dr
- 39247 Hawthorne Dr
- 3473 Moon Rd
- 37097 Hunters Trail
- 2007 W Reserve Cir
- 2417 Muirwood Rd
- 2429 Muirwood Rd
- 2415 Muirwood Rd
- 2416 Muirwood Rd
- 2420 Muirwood Rd
- 2424 Muirwood Rd
- 2433 Muirwood Rd
- 2428 Muirwood Rd
- 2437 Muirwood Rd
- 2411 Muirwood Rd
- 2432 Muirwood Rd
- 2441 Muirwood Rd
- 2405 Muirwood Rd
- 38207 Heron Ln
- 2436 Muirwood Rd
- 2445 Muirwood Rd
- 38441 Berkshire Ave
- 2403 Muirwood Rd
- 38205 Heron Ln
- 38481 Berkshire Ave