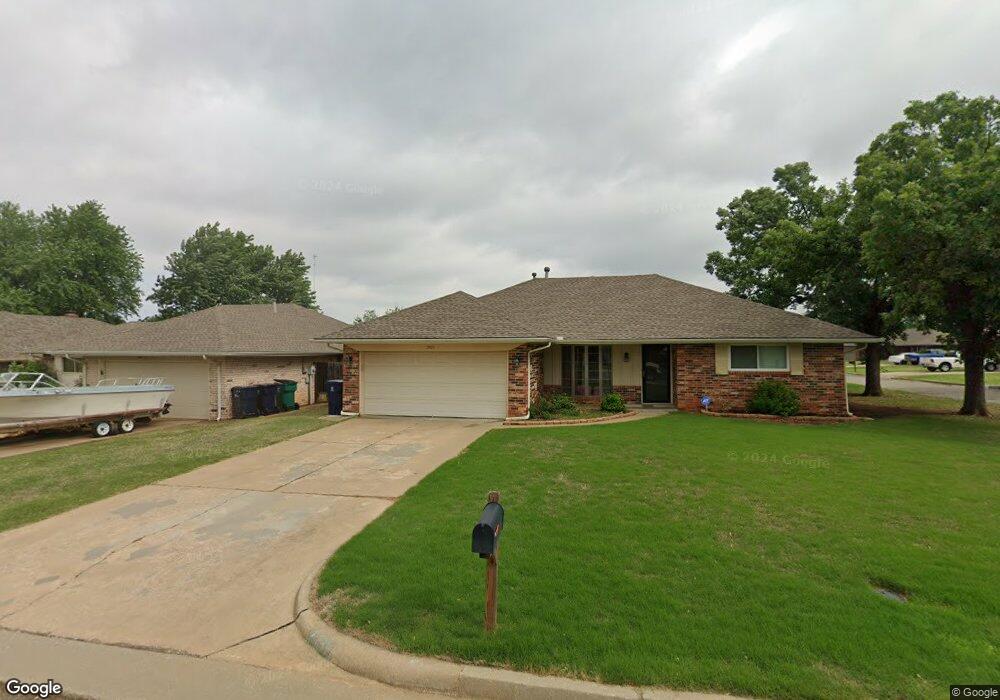
2421 Pinon Place Edmond, OK 73013
Smiling Hill/Whispering Heights NeighborhoodEstimated Value: $198,215 - $230,000
3
Beds
2
Baths
1,514
Sq Ft
$139/Sq Ft
Est. Value
About This Home
This home is located at 2421 Pinon Place, Edmond, OK 73013 and is currently estimated at $210,804, approximately $139 per square foot. 2421 Pinon Place is a home located in Oklahoma County with nearby schools including Orvis Risner Elementary School, Cimarron Middle School, and Memorial High School.
Ownership History
Date
Name
Owned For
Owner Type
Purchase Details
Closed on
Mar 3, 2022
Sold by
Alan Barnes Mark and Kay Jana
Bought by
Mjak Properties Llc
Current Estimated Value
Purchase Details
Closed on
Jan 20, 2017
Sold by
Mjak Properties Llc
Bought by
Barnes Mark Allan and Barnes Jana Kay
Purchase Details
Closed on
Feb 29, 2016
Sold by
Barnes Mark A and Barnes Jana K
Bought by
Mjak Properties Llc
Purchase Details
Closed on
May 8, 2012
Sold by
Duell Elzora F and Duell Elzora Finas
Bought by
Barnes Mark A and Barnes Jana K
Purchase Details
Closed on
Sep 23, 2005
Sold by
Allen D Eric and Allen Roberta June
Bought by
Duell Barton and Duell Elzora F
Home Financials for this Owner
Home Financials are based on the most recent Mortgage that was taken out on this home.
Original Mortgage
$99,000
Interest Rate
5.65%
Mortgage Type
New Conventional
Create a Home Valuation Report for This Property
The Home Valuation Report is an in-depth analysis detailing your home's value as well as a comparison with similar homes in the area
Home Values in the Area
Average Home Value in this Area
Purchase History
| Date | Buyer | Sale Price | Title Company |
|---|---|---|---|
| Mjak Properties Llc | -- | None Listed On Document | |
| Barnes Mark Allan | -- | Old Republic Title | |
| Mjak Properties Llc | -- | Attorney | |
| Barnes Mark A | $100,000 | American Eagle Title Group | |
| Duell Barton | $110,000 | Stewart Abstract & Title Of |
Source: Public Records
Mortgage History
| Date | Status | Borrower | Loan Amount |
|---|---|---|---|
| Previous Owner | Duell Barton | $99,000 |
Source: Public Records
Tax History Compared to Growth
Tax History
| Year | Tax Paid | Tax Assessment Tax Assessment Total Assessment is a certain percentage of the fair market value that is determined by local assessors to be the total taxable value of land and additions on the property. | Land | Improvement |
|---|---|---|---|---|
| 2024 | $2,143 | $18,909 | $3,435 | $15,474 |
| 2023 | $2,143 | $18,008 | $3,362 | $14,646 |
| 2022 | $2,060 | $17,151 | $3,617 | $13,534 |
| 2021 | $1,942 | $16,335 | $3,415 | $12,920 |
| 2020 | $1,878 | $15,565 | $3,415 | $12,150 |
| 2019 | $1,857 | $15,303 | $3,299 | $12,004 |
| 2018 | $1,779 | $14,575 | $0 | $0 |
| 2017 | $1,822 | $15,014 | $3,255 | $11,759 |
| 2016 | $1,752 | $14,519 | $3,255 | $11,264 |
| 2015 | $1,826 | $15,048 | $3,255 | $11,793 |
| 2014 | $1,747 | $14,435 | $3,255 | $11,180 |
Source: Public Records
Map
Nearby Homes
- 2321 Pinon Place
- 2328 Butternut Place
- 2401 Butternut Place
- 2437 Shady Tree Ln
- 16308 Marsha Dr
- 2817 Shady Tree Ln
- 13400 Cedar Pointe Dr
- 13425 Creek Pointe Ln
- 2912 NE 133rd St
- 13209 Golden Eagle Dr
- 13500 Fox Creek Dr
- 13504 Fox Creek Dr
- 13308 Creekside Dr
- 3109 Eagle Crest Rd
- 13917 Briarwyck
- 1204 Sims Ave
- 13509 Silver Eagle Trail
- 13500 Green Cedar Ln
- 3809 Grandview Terrace
- 1516 Two Bridge Dr
- 2417 Pinon Place
- 2420 Red Elm Ct
- 2416 Red Elm Ct
- 13500 Pecan Place
- 13504 Pecan Place
- 2424 Pinon Place
- 2420 Pinon Place
- 2412 Red Elm Ct
- 13508 Pecan Place
- 2416 Pinon Place
- 2409 Pinon Place
- 2428 Pinon Place
- 13512 Pecan Place
- 2408 Red Elm Ct
- 2432 Pinon Place
- 2405 Pinon Place
- 2408 Pinon Place
- 2500 Clemson Ct
- 2429 Cypress Ct
- 2425 Cypress Ct