2421 Sunflower Dr Hoschton, GA 30548
Estimated Value: $804,000 - $863,000
--
Bed
1
Bath
4,769
Sq Ft
$173/Sq Ft
Est. Value
About This Home
This home is located at 2421 Sunflower Dr, Hoschton, GA 30548 and is currently estimated at $825,191, approximately $173 per square foot. 2421 Sunflower Dr is a home with nearby schools including Bramlett Elementary School, Russell Middle School, and Winder-Barrow High School.
Ownership History
Date
Name
Owned For
Owner Type
Purchase Details
Closed on
Sep 28, 2018
Sold by
Kelley Michael W
Bought by
Kelley Michael W and Kelley Mary B
Current Estimated Value
Purchase Details
Closed on
May 25, 2011
Sold by
Southfork Homes Llc
Bought by
Kelley Michael W
Home Financials for this Owner
Home Financials are based on the most recent Mortgage that was taken out on this home.
Original Mortgage
$300,192
Interest Rate
4.75%
Mortgage Type
FHA
Purchase Details
Closed on
Jan 28, 2011
Sold by
Kelley Michael W
Bought by
Southfork Homes Llc
Purchase Details
Closed on
Dec 30, 2010
Sold by
Arborwood Dev Inc
Bought by
Kelley Michael W
Purchase Details
Closed on
May 18, 2006
Sold by
Walthoo Development Llc
Bought by
Arborwood Development Inc
Purchase Details
Closed on
May 18, 2005
Bought by
Walthoo Development Llc
Create a Home Valuation Report for This Property
The Home Valuation Report is an in-depth analysis detailing your home's value as well as a comparison with similar homes in the area
Home Values in the Area
Average Home Value in this Area
Purchase History
| Date | Buyer | Sale Price | Title Company |
|---|---|---|---|
| Kelley Michael W | -- | -- | |
| Kelley Michael W | $308,000 | -- | |
| Southfork Homes Llc | -- | -- | |
| Kelley Michael W | $75,000 | -- | |
| Arborwood Development Inc | -- | -- | |
| Walthoo Development Llc | -- | -- |
Source: Public Records
Mortgage History
| Date | Status | Borrower | Loan Amount |
|---|---|---|---|
| Previous Owner | Kelley Michael W | $300,192 |
Source: Public Records
Tax History Compared to Growth
Tax History
| Year | Tax Paid | Tax Assessment Tax Assessment Total Assessment is a certain percentage of the fair market value that is determined by local assessors to be the total taxable value of land and additions on the property. | Land | Improvement |
|---|---|---|---|---|
| 2024 | $6,188 | $253,408 | $35,200 | $218,208 |
| 2023 | $5,768 | $254,008 | $35,200 | $218,808 |
| 2022 | $5,083 | $180,165 | $35,200 | $144,965 |
| 2021 | $5,324 | $178,165 | $35,200 | $142,965 |
| 2020 | $5,334 | $178,165 | $35,200 | $142,965 |
| 2019 | $5,429 | $178,165 | $35,200 | $142,965 |
| 2018 | $5,385 | $178,165 | $35,200 | $142,965 |
| 2017 | $4,538 | $155,854 | $35,200 | $120,654 |
| 2016 | $4,342 | $145,229 | $35,200 | $110,029 |
| 2015 | $4,394 | $146,265 | $35,200 | $111,065 |
| 2014 | $3,671 | $119,348 | $17,248 | $102,100 |
| 2013 | -- | $110,130 | $17,248 | $92,882 |
Source: Public Records
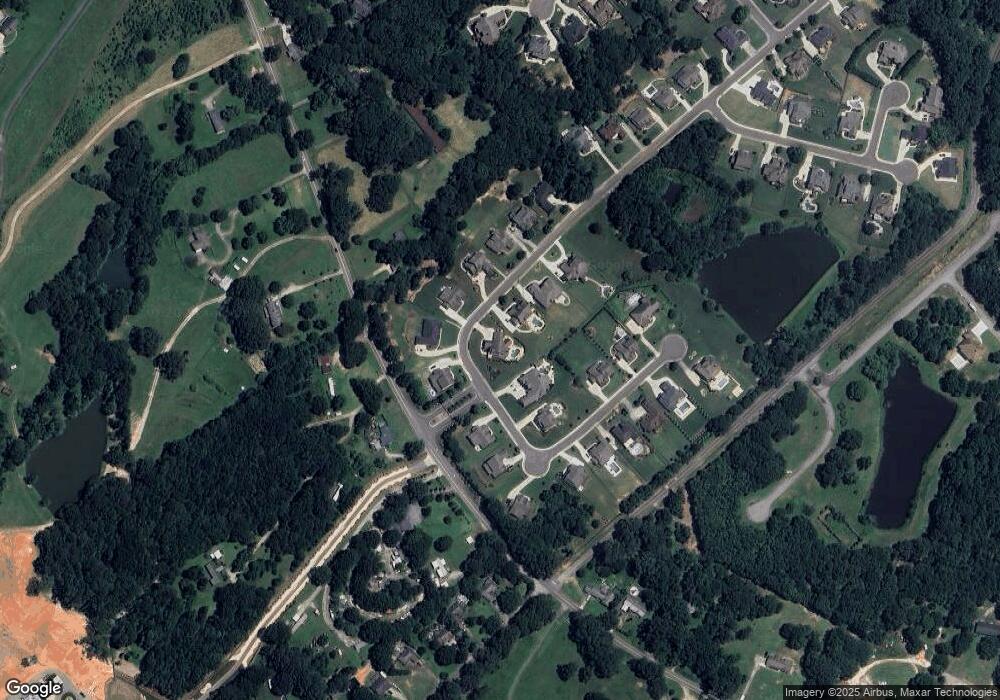
Map
Nearby Homes
- 2417 Sunflower Dr
- 1453 Dee Kennedy Rd
- 2711 Wildflower Way
- 1151 Emperor Ln
- 1678 Thomas Dr
- 1646 Thomas Dr
- 1841 Hidden Creek Dr
- 1035 Fleeman Rd
- 1438 Elliotts Ln
- 1226 Summer Ln
- 1380 Cronic Town Rd
- 1431 Torrington Dr
- 1054 Iron Wood Ct
- 4533 Mulberry Fields Ln
- 940 Chateau Forest Rd
- 5171 Woodline
- 5747 Wheeler Rd
- 1431 Winding Ridge Trail
- 2416 Sunflower Dr
- 2420 Sunflower Dr
- 2427 Sunflower Dr Unit 16
- 2427 Sunflower Dr
- 2417 Sunflower Dr Unit GA
- 2429 Sunflower Dr
- 2415 Sunflower Dr
- 2422 Sunflower Dr
- 2405 Sunflower Dr
- 2424 Sunflower Dr
- 2426 Sunflower Dr Unit 74A
- 2426 Sunflower Dr Unit 1
- 2431 Sunflower Dr
- 2403 Sunflower Dr
- 2414 Sunflower Dr
- 2430 Sunflower Dr
- 2401 Sunflower Dr
- 2432 Sunflower Dr
- 2408 Sunflower Dr
- 2406 Sunflower Dr