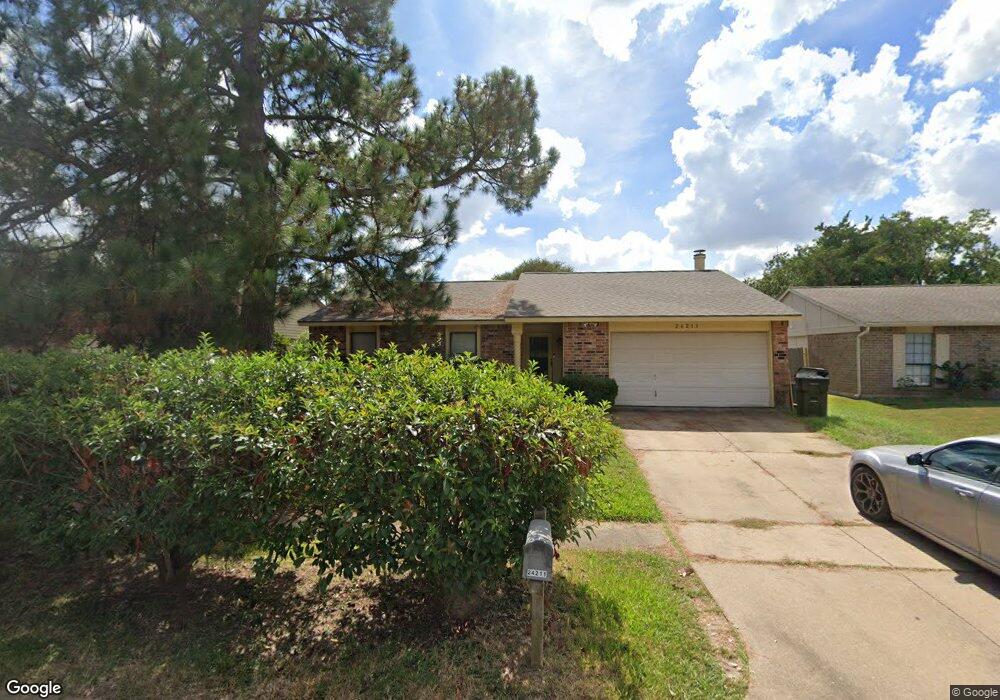
24211 Beef Canyon Dr Hockley, TX 77447
Hockley NeighborhoodEstimated Value: $209,000 - $217,000
3
Beds
2
Baths
1,400
Sq Ft
$152/Sq Ft
Est. Value
About This Home
This home is located at 24211 Beef Canyon Dr, Hockley, TX 77447 and is currently estimated at $212,668, approximately $151 per square foot. 24211 Beef Canyon Dr is a home located in Harris County with nearby schools including Roberts Road Elementary School, Waller Junior High School, and Waller High School.
Ownership History
Date
Name
Owned For
Owner Type
Purchase Details
Closed on
May 8, 2002
Sold by
Byler James and Byler Ginny
Bought by
Contravis Desiree L
Current Estimated Value
Home Financials for this Owner
Home Financials are based on the most recent Mortgage that was taken out on this home.
Original Mortgage
$59,341
Outstanding Balance
$32,563
Interest Rate
7.19%
Mortgage Type
USDA
Estimated Equity
$180,105
Purchase Details
Closed on
Jan 15, 2002
Sold by
Carpenter Steve and Carpenter Tonya
Bought by
Byler James and Byler Ginny
Purchase Details
Closed on
Apr 1, 2001
Sold by
Carpenter Steve A and Carpenter Tonya S
Bought by
Byler James and Byler Ginny
Home Financials for this Owner
Home Financials are based on the most recent Mortgage that was taken out on this home.
Original Mortgage
$32,973
Interest Rate
7.16%
Mortgage Type
Seller Take Back
Create a Home Valuation Report for This Property
The Home Valuation Report is an in-depth analysis detailing your home's value as well as a comparison with similar homes in the area
Home Values in the Area
Average Home Value in this Area
Purchase History
| Date | Buyer | Sale Price | Title Company |
|---|---|---|---|
| Contravis Desiree L | -- | Alamo Title 17 | |
| Byler James | $12,700 | -- | |
| Byler James | $49,973 | -- |
Source: Public Records
Mortgage History
| Date | Status | Borrower | Loan Amount |
|---|---|---|---|
| Open | Contravis Desiree L | $59,341 | |
| Previous Owner | Byler James | $32,973 | |
| Closed | Byler James | $0 |
Source: Public Records
Tax History Compared to Growth
Tax History
| Year | Tax Paid | Tax Assessment Tax Assessment Total Assessment is a certain percentage of the fair market value that is determined by local assessors to be the total taxable value of land and additions on the property. | Land | Improvement |
|---|---|---|---|---|
| 2025 | $3,096 | $197,200 | $34,650 | $162,550 |
| 2024 | $3,096 | $189,854 | $34,650 | $155,204 |
| 2023 | $3,096 | $192,626 | $34,650 | $157,976 |
| 2022 | $3,924 | $168,817 | $34,650 | $134,167 |
| 2021 | $3,735 | $139,630 | $28,350 | $111,280 |
| 2020 | $3,506 | $123,721 | $26,775 | $96,946 |
| 2019 | $3,296 | $115,406 | $22,050 | $93,356 |
| 2018 | $838 | $100,372 | $22,050 | $78,322 |
| 2017 | $2,966 | $100,372 | $22,050 | $78,322 |
| 2016 | $2,613 | $88,426 | $22,050 | $66,376 |
| 2015 | $1,093 | $81,883 | $15,120 | $66,763 |
| 2014 | $1,093 | $54,525 | $15,120 | $39,405 |
Source: Public Records
Map
Nearby Homes
- 17506 Bullis Gap Dr
- 24211 Four Sixes Ln
- 24402 Jumping Jay Dr
- 24303 Four Sixes Ln
- 24310 Rockin Seven Dr
- 24039 Rockin Seven Dr
- 24231 Wild Horse Ln
- 24414 Broken Bow Ln
- 2076 Stallion Lakes Ave
- 24402 Bar Kay Ln
- 24503 Wild Horse Ln
- 17607 Lavender Blossom Ln
- 17419 Lavender Blossom Ln
- 17423 Lavender Blossom Ln
- 17503 Lavender Blossom Ln
- 17247 Osprey Forest Dr
- 0 Lazy Kay Ln
- 17222 Osprey Landing Dr
- 32103 Sweet Pea Meadows Dr
- 32115 Waterlily View Ct
- 24207 Beef Canyon Dr
- 24215 Beef Canyon Dr
- 24210 Jumping Jay Dr
- 24206 Jumping Jay Dr
- 24219 Beef Canyon Dr
- 24214 Jumping Jay Dr
- 24203 Beef Canyon Dr
- 24202 Jumping Jay Dr
- 24218 Jumping Jay Dr
- 24210 Beef Canyon Dr
- 24214 Beef Canyon Dr
- 24206 Beef Canyon Dr
- 24303 Beef Canyon Dr
- 24218 Beef Canyon Dr
- 24202 Beef Canyon Dr
- 24222 Jumping Jay Dr
- 24307 Beef Canyon Dr
- 24302 Beef Canyon Dr
- 24302 Jumping Jay Dr
- 24211 Jumping Jay Dr