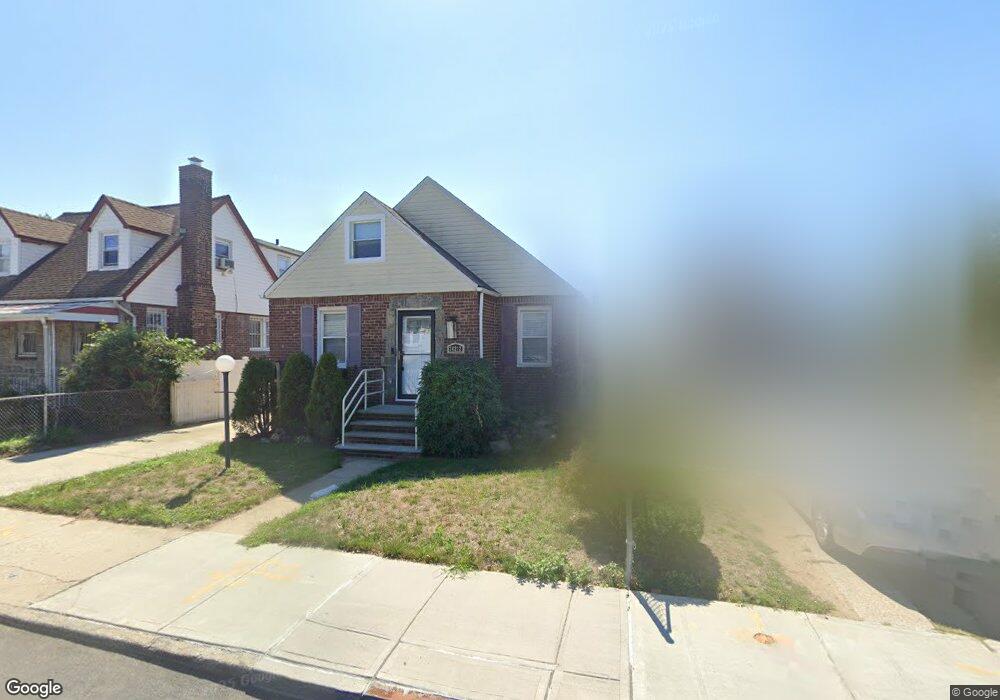
24212 130th Ave Rosedale, NY 11422
Rosedale NeighborhoodEstimated Value: $636,000 - $749,406
--
Bed
--
Bath
1,515
Sq Ft
$475/Sq Ft
Est. Value
About This Home
This home is located at 24212 130th Ave, Rosedale, NY 11422 and is currently estimated at $720,352, approximately $475 per square foot. 24212 130th Ave is a home located in Queens County with nearby schools including P.S. 38 - Rosedale, Collaborative Arts Middle School, and Mona Prep.
Ownership History
Date
Name
Owned For
Owner Type
Purchase Details
Closed on
May 15, 2024
Sold by
Chinshue Donald V and Coombs Sharon A
Bought by
Romero Jimmy M
Current Estimated Value
Home Financials for this Owner
Home Financials are based on the most recent Mortgage that was taken out on this home.
Original Mortgage
$710,469
Outstanding Balance
$700,507
Interest Rate
6.88%
Mortgage Type
Purchase Money Mortgage
Estimated Equity
$19,845
Purchase Details
Closed on
May 24, 2021
Sold by
Barbara Esposito 2005 Family Trust and Joseph
Bought by
Chinshue Donald V and Coombs Sharon A
Home Financials for this Owner
Home Financials are based on the most recent Mortgage that was taken out on this home.
Original Mortgage
$348,750
Interest Rate
2.9%
Mortgage Type
Purchase Money Mortgage
Purchase Details
Closed on
Feb 15, 2005
Sold by
Esposito Barbara
Bought by
Barbara Esposito 2005 Trust Agreement and Esposito Trustee Barbara
Create a Home Valuation Report for This Property
The Home Valuation Report is an in-depth analysis detailing your home's value as well as a comparison with similar homes in the area
Home Values in the Area
Average Home Value in this Area
Purchase History
| Date | Buyer | Sale Price | Title Company |
|---|---|---|---|
| Romero Jimmy M | $735,000 | -- | |
| Romero Jimmy M | $735,000 | -- | |
| Chinshue Donald V | $465,000 | -- | |
| Chinshue Donald V | $465,000 | -- | |
| Barbara Esposito 2005 Trust Agreement | -- | -- | |
| Barbara Esposito 2005 Trust Agreement | -- | -- |
Source: Public Records
Mortgage History
| Date | Status | Borrower | Loan Amount |
|---|---|---|---|
| Open | Romero Jimmy M | $710,469 | |
| Closed | Romero Jimmy M | $710,469 | |
| Previous Owner | Chinshue Donald V | $348,750 |
Source: Public Records
Tax History Compared to Growth
Tax History
| Year | Tax Paid | Tax Assessment Tax Assessment Total Assessment is a certain percentage of the fair market value that is determined by local assessors to be the total taxable value of land and additions on the property. | Land | Improvement |
|---|---|---|---|---|
| 2025 | $6,145 | $32,428 | $7,464 | $24,964 |
| 2024 | $6,145 | $30,594 | $7,583 | $23,011 |
| 2023 | $5,797 | $28,862 | $6,322 | $22,540 |
| 2022 | $5,606 | $36,720 | $8,700 | $28,020 |
| 2021 | $2,258 | $32,700 | $8,700 | $24,000 |
| 2020 | $2,201 | $29,460 | $8,700 | $20,760 |
| 2019 | $2,008 | $32,040 | $8,700 | $23,340 |
| 2018 | $1,792 | $24,052 | $8,264 | $15,788 |
| 2017 | $1,739 | $23,400 | $8,700 | $14,700 |
| 2016 | $1,688 | $23,400 | $8,700 | $14,700 |
| 2015 | $930 | $22,519 | $9,417 | $13,102 |
| 2014 | $930 | $21,246 | $9,371 | $11,875 |
Source: Public Records
Map
Nearby Homes
- 128-35 Brookville Blvd
- 130-21 235th St
- 11 Jefferson Ave
- 24016 128th Rd
- 128- 60 236th St
- 128-36 Hook Creek Blvd
- 132-29 Brookville Blvd
- 234-16 130th Ave
- 131-30 Laurelton Pkwy Unit Upper
- 131- 44 Laurelton Pkwy Unit Lower
- 131-09 234th St Unit Lower Level
- 12810 236th St
- 131-31 234th St Unit 2nd Fl
- 63 Cumberland Place
- 233-6 131st Ave Unit 1
- 130-28 233rd St
- 12819 234th St
- 131-56 234th St Unit Lower
- 23432 133rd Ave Unit LOWER
- 234-5 133rd Ave Unit Lower
- 242-12 130th Ave
- 13005 Brookville Blvd
- 24216 130th Ave
- 24220 130th Ave
- 24219 130th Rd
- 24215 130th Rd
- 24223 130th Rd
- 24224 130th Ave
- 24227 130th Rd
- 24211 130th Rd
- 12945 Brookville Blvd
- 242-19 130th Rd
- 24231 130th Rd
- 13005 Laurelton Pkwy
- 24228 130th Ave
- 12941 Brookville Blvd
- 24235 130th Rd
- 24235 130th Rd
- 24225 130th Ave
- 24232 130th Ave