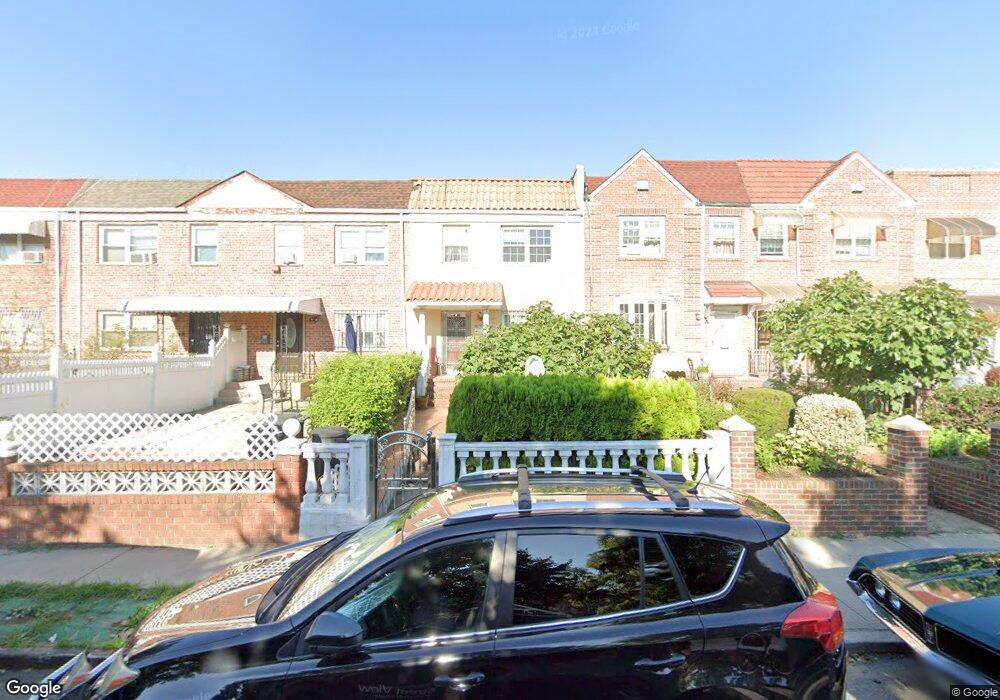
2422 87th St East Elmhurst, NY 11369
Jackson Heights NeighborhoodEstimated Value: $779,226 - $888,000
--
Bed
--
Bath
1,224
Sq Ft
$686/Sq Ft
Est. Value
About This Home
This home is located at 2422 87th St, East Elmhurst, NY 11369 and is currently estimated at $840,057, approximately $686 per square foot. 2422 87th St is a home located in Queens County with nearby schools including P.S. 127 Aerospace Science Magnet School, Is 141 The Steinway, and William Cullen Bryant High School.
Ownership History
Date
Name
Owned For
Owner Type
Purchase Details
Closed on
Jun 8, 2010
Sold by
Ahmed Rezine
Bought by
Ahmed Rezine and Ahmed Saleh
Current Estimated Value
Purchase Details
Closed on
Nov 7, 1997
Sold by
Stumpo Carmela
Bought by
Ahmed Rezine
Home Financials for this Owner
Home Financials are based on the most recent Mortgage that was taken out on this home.
Original Mortgage
$113,250
Interest Rate
6.7%
Mortgage Type
Purchase Money Mortgage
Create a Home Valuation Report for This Property
The Home Valuation Report is an in-depth analysis detailing your home's value as well as a comparison with similar homes in the area
Home Values in the Area
Average Home Value in this Area
Purchase History
| Date | Buyer | Sale Price | Title Company |
|---|---|---|---|
| Ahmed Rezine | -- | -- | |
| Ahmed Rezine | $151,000 | Commonwealth Land Title Ins |
Source: Public Records
Mortgage History
| Date | Status | Borrower | Loan Amount |
|---|---|---|---|
| Previous Owner | Ahmed Rezine | $113,250 |
Source: Public Records
Tax History Compared to Growth
Tax History
| Year | Tax Paid | Tax Assessment Tax Assessment Total Assessment is a certain percentage of the fair market value that is determined by local assessors to be the total taxable value of land and additions on the property. | Land | Improvement |
|---|---|---|---|---|
| 2025 | $6,024 | $35,821 | $4,750 | $31,071 |
| 2024 | $6,128 | $33,793 | $4,210 | $29,583 |
| 2023 | $5,640 | $31,882 | $3,840 | $28,042 |
| 2022 | $2,353 | $52,320 | $6,540 | $45,780 |
| 2021 | $2,671 | $48,720 | $6,540 | $42,180 |
| 2020 | $2,500 | $42,360 | $6,540 | $35,820 |
| 2019 | $2,286 | $43,200 | $6,540 | $36,660 |
| 2018 | $2,049 | $26,568 | $4,265 | $22,303 |
| 2017 | $3,145 | $26,568 | $5,850 | $20,718 |
| 2016 | $2,805 | $26,568 | $5,850 | $20,718 |
| 2015 | $3,152 | $24,876 | $6,543 | $18,333 |
| 2014 | $3,152 | $23,468 | $6,729 | $16,739 |
Source: Public Records
Map
Nearby Homes