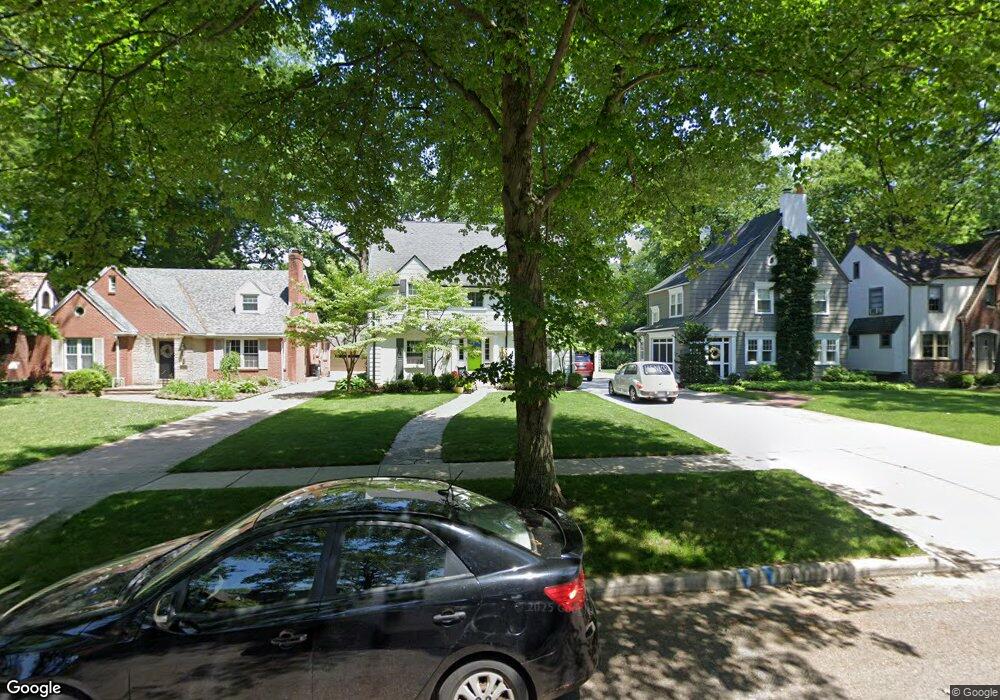
2422 Barrington Dr Toledo, OH 43606
Ottawa NeighborhoodEstimated Value: $279,475 - $343,000
4
Beds
2
Baths
1,867
Sq Ft
$164/Sq Ft
Est. Value
About This Home
This home is located at 2422 Barrington Dr, Toledo, OH 43606 and is currently estimated at $305,619, approximately $163 per square foot. 2422 Barrington Dr is a home located in Lucas County with nearby schools including Old Orchard Elementary School, Start High School, and Central Academy Of Ohio.
Ownership History
Date
Name
Owned For
Owner Type
Purchase Details
Closed on
Mar 14, 2002
Sold by
Cendol Robert J
Bought by
Hurst Tred E and Hurst Allison K
Current Estimated Value
Home Financials for this Owner
Home Financials are based on the most recent Mortgage that was taken out on this home.
Original Mortgage
$148,500
Outstanding Balance
$61,552
Interest Rate
6.95%
Estimated Equity
$244,067
Purchase Details
Closed on
Jul 24, 2000
Sold by
Louisville Title Agency For Nw Ohio Inc
Bought by
Cendol Robert and Cendol Michelle
Purchase Details
Closed on
Dec 22, 1997
Sold by
Trst Lois M Russell
Bought by
Cendol Robert J
Home Financials for this Owner
Home Financials are based on the most recent Mortgage that was taken out on this home.
Original Mortgage
$103,200
Interest Rate
7.36%
Mortgage Type
Balloon
Purchase Details
Closed on
Mar 26, 1992
Sold by
Russel Lois M #
Purchase Details
Closed on
Apr 30, 1991
Sold by
Russel J M and L M
Create a Home Valuation Report for This Property
The Home Valuation Report is an in-depth analysis detailing your home's value as well as a comparison with similar homes in the area
Home Values in the Area
Average Home Value in this Area
Purchase History
| Date | Buyer | Sale Price | Title Company |
|---|---|---|---|
| Hurst Tred E | $208,500 | Northwest Title Agency Of Oh | |
| Cendol Robert | $45,900 | Louisville Title Agency For | |
| Cendol Robert J | $129,000 | -- | |
| -- | -- | -- | |
| -- | -- | -- |
Source: Public Records
Mortgage History
| Date | Status | Borrower | Loan Amount |
|---|---|---|---|
| Open | Hurst Tred E | $148,500 | |
| Previous Owner | Cendol Robert J | $103,200 |
Source: Public Records
Tax History Compared to Growth
Tax History
| Year | Tax Paid | Tax Assessment Tax Assessment Total Assessment is a certain percentage of the fair market value that is determined by local assessors to be the total taxable value of land and additions on the property. | Land | Improvement |
|---|---|---|---|---|
| 2024 | $2,105 | $70,875 | $10,080 | $60,795 |
| 2023 | $4,302 | $69,790 | $9,730 | $60,060 |
| 2022 | $4,309 | $69,790 | $9,730 | $60,060 |
| 2021 | $4,428 | $69,790 | $9,730 | $60,060 |
| 2020 | $4,130 | $57,785 | $8,085 | $49,700 |
| 2019 | $4,029 | $57,785 | $8,085 | $49,700 |
| 2018 | $3,818 | $57,785 | $8,085 | $49,700 |
| 2017 | $3,674 | $49,700 | $7,805 | $41,895 |
| 2016 | $3,647 | $142,000 | $22,300 | $119,700 |
| 2015 | $3,607 | $142,000 | $22,300 | $119,700 |
| 2014 | $3,126 | $49,710 | $7,810 | $41,900 |
| 2013 | $3,126 | $49,710 | $7,810 | $41,900 |
Source: Public Records
Map
Nearby Homes
- 2324 Middlesex Dr
- 2310 Goddard Rd
- 2541 Goddard Rd
- 2550 Secor Rd
- 3225 Kenwood Blvd
- 3329 Darlington Rd
- 3305 W Bancroft St
- 3155 Kylemore Rd
- 2013 Bretton Place
- 2009 Bretton Place
- 2829 Goddard Rd
- 2824 Secor Rd
- 2627 Latonia Blvd
- 2929 Meadowwood Dr
- 3447 Kingsgate Rd
- 2924 Goddard Rd
- 2679 Latonia Blvd
- 2003 Farnham Rd
- 2547 Greenway St
- 3115 Drummond Rd
- 2426 Barrington Dr
- 2416 Barrington Dr
- 2432 Barrington Dr
- 2412 Barrington Dr
- 2436 Barrington Dr
- 2406 Barrington Dr
- 2425 Meadowwood Dr
- 2433 Meadowwood Dr
- 2444 Barrington Dr
- 2402 Barrington Dr
- 2423 Barrington Dr
- 2407 Meadowwood Dr
- 2437 Meadowwood Dr
- 2417 Barrington Dr
- 2427 Barrington Dr
- 2411 Barrington Dr
- 2433 Barrington Dr
- 2443 Meadowwood Dr
- 2403 Meadowwood Dr
- 2407 Barrington Dr