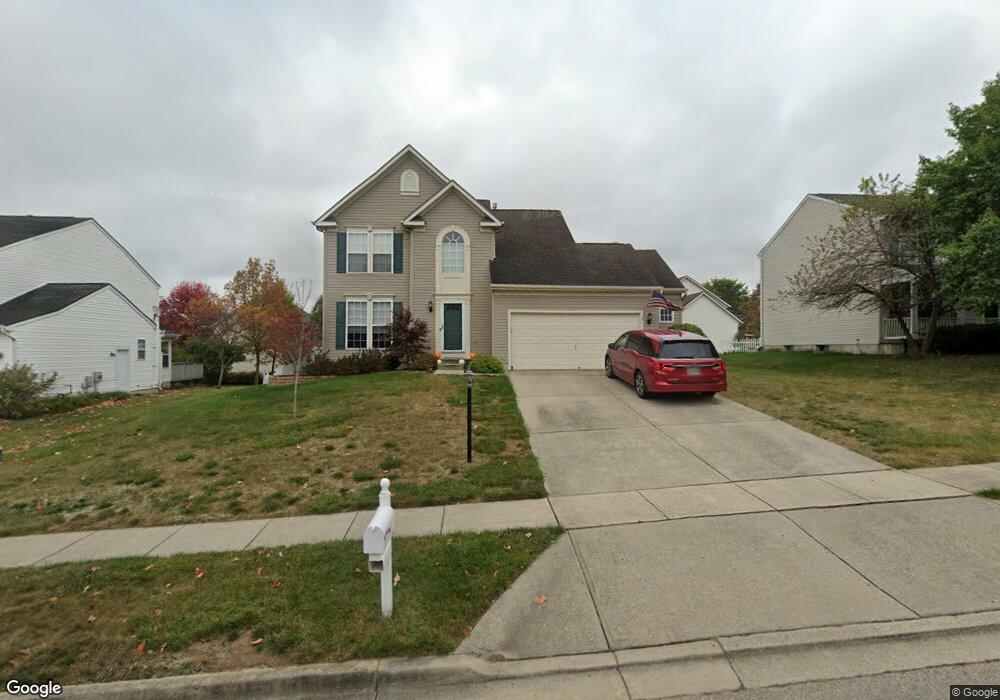
2422 Blacksmith Ln Dayton, OH 45434
Estimated Value: $345,620 - $409,000
3
Beds
3
Baths
1,660
Sq Ft
$232/Sq Ft
Est. Value
About This Home
This home is located at 2422 Blacksmith Ln, Dayton, OH 45434 and is currently estimated at $385,655, approximately $232 per square foot. 2422 Blacksmith Ln is a home located in Greene County with nearby schools including Trebein Elementary School, Jacob Coy Middle School, and Beavercreek High School.
Ownership History
Date
Name
Owned For
Owner Type
Purchase Details
Closed on
Apr 28, 2021
Sold by
Kreiner Kyle L and Kreiner Kyle L
Bought by
Kreiner Kyle L and Kreiner Aerial N
Current Estimated Value
Purchase Details
Closed on
May 4, 2016
Sold by
Cravens Robert C and Cravens Lisa A
Bought by
Kreiner Kyle L and Camden Aerial N
Home Financials for this Owner
Home Financials are based on the most recent Mortgage that was taken out on this home.
Original Mortgage
$188,900
Outstanding Balance
$150,034
Interest Rate
3.59%
Mortgage Type
New Conventional
Estimated Equity
$235,621
Purchase Details
Closed on
Jun 11, 1999
Sold by
Nvr Inc
Bought by
Cravens Ii Robert C and Wurst Lisa A
Home Financials for this Owner
Home Financials are based on the most recent Mortgage that was taken out on this home.
Original Mortgage
$128,900
Interest Rate
7.06%
Purchase Details
Closed on
Feb 19, 1999
Sold by
Arnold Rhoads Morgan Development
Bought by
Nvr Inc
Create a Home Valuation Report for This Property
The Home Valuation Report is an in-depth analysis detailing your home's value as well as a comparison with similar homes in the area
Home Values in the Area
Average Home Value in this Area
Purchase History
| Date | Buyer | Sale Price | Title Company |
|---|---|---|---|
| Kreiner Kyle L | -- | None Available | |
| Kreiner Kyle L | $209,900 | None Available | |
| Cravens Ii Robert C | $153,200 | -- | |
| Nvr Inc | $33,000 | -- |
Source: Public Records
Mortgage History
| Date | Status | Borrower | Loan Amount |
|---|---|---|---|
| Open | Kreiner Kyle L | $188,900 | |
| Previous Owner | Cravens Ii Robert C | $128,900 |
Source: Public Records
Tax History Compared to Growth
Tax History
| Year | Tax Paid | Tax Assessment Tax Assessment Total Assessment is a certain percentage of the fair market value that is determined by local assessors to be the total taxable value of land and additions on the property. | Land | Improvement |
|---|---|---|---|---|
| 2024 | $5,502 | $97,820 | $17,500 | $80,320 |
| 2023 | $5,502 | $97,820 | $17,500 | $80,320 |
| 2022 | $4,911 | $76,530 | $14,000 | $62,530 |
| 2021 | $4,959 | $76,530 | $14,000 | $62,530 |
| 2020 | $4,983 | $76,530 | $14,000 | $62,530 |
| 2019 | $4,999 | $70,500 | $11,990 | $58,510 |
| 2018 | $4,358 | $70,500 | $11,990 | $58,510 |
| 2017 | $3,816 | $70,500 | $11,990 | $58,510 |
| 2016 | $3,763 | $60,090 | $11,990 | $48,100 |
| 2015 | $3,787 | $60,090 | $11,990 | $48,100 |
| 2014 | $3,699 | $60,090 | $11,990 | $48,100 |
Source: Public Records
Map
Nearby Homes
- 2162 Sulky Trail
- 2331 Eastwind Dr
- 1535 Stretch Dr
- 2073 Lincolnshire Dr
- 2507 Obetz Dr
- 1238 Freedom Point
- 2170 Schmidt Dr N
- 2451 Dakem Dr
- 2067 Codaz Way
- Hudson Plan at Nathanials Grove Estates
- Cumberland Plan at Nathanials Grove Estates
- Lehigh Plan at Nathanials Grove Estates
- Ballenger Plan at Nathanials Grove Estates
- Aviano Plan at Nathanials Grove Estates
- Allegheny Plan at Nathanials Grove Estates
- 1678 Fairground Rd
- 1247 Homestead Dr
- 895 Alpha Rd
- 2068 Creswell Dr
- 2282 Whitey Marshall Dr
- 2416 Blacksmith Ln
- 2198 Sulky Trail
- 2179 Pacer Trail
- 2192 Sulky Trail
- 2207 Pacer Ct
- 2214 Sulky Ct
- 2173 Pacer Trail
- 2184 Sulky Trail
- 2211 Pacer Ct
- 2188 Pacer Trail
- 2195 Sulky Trail
- 2180 Pacer Trail
- 2167 Pacer Trail
- 2178 Sulky Trail
- 2189 Sulky Trail
- 2217 Sulky Ct
- 2174 Pacer Trail
- 2219 Pacer Ct
- 2183 Sulky Trail
- 2168 Pacer Trail