Estimated Value: $392,000 - $418,000
6
Beds
2
Baths
2,250
Sq Ft
$180/Sq Ft
Est. Value
About This Home
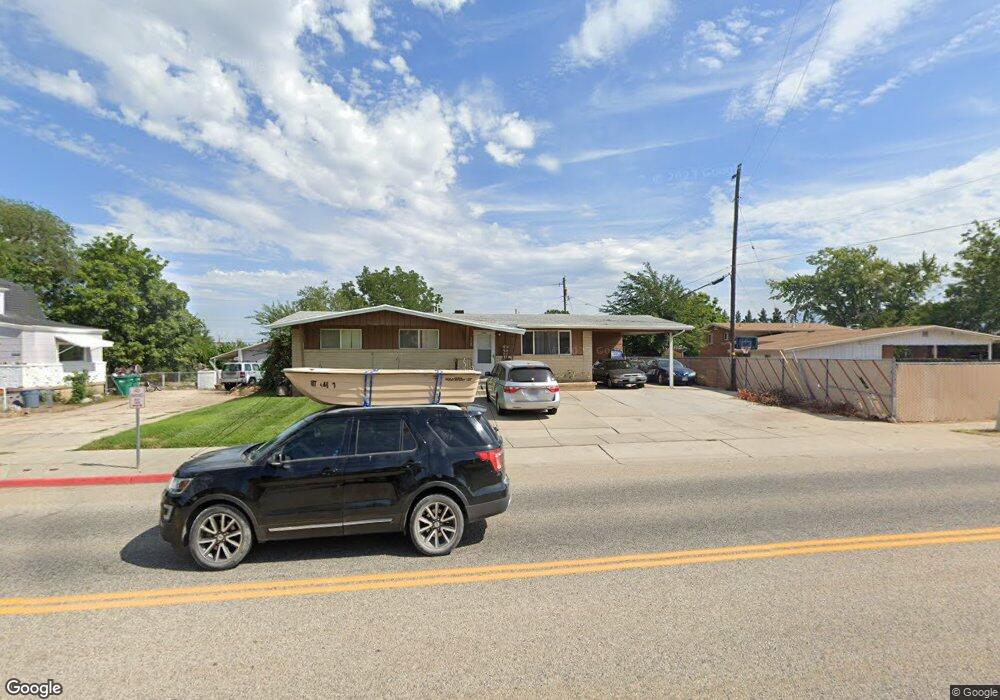
This home is located at 2422 W 4800 S, Roy, UT 84067 and is currently estimated at $405,686, approximately $180 per square foot. 2422 W 4800 S is a home located in Weber County with nearby schools including Valley View School, Sand Ridge Junior High School, and Roy High School.
Ownership History
Date
Name
Owned For
Owner Type
Purchase Details
Closed on
Dec 6, 2022
Sold by
Anderson Chad J
Bought by
Rmhf Ii Series Llc
Current Estimated Value
Purchase Details
Closed on
Apr 8, 2020
Sold by
M Burton Property Management Llc
Bought by
Cragun Daniel R and Cragun Colleen W
Purchase Details
Closed on
Aug 21, 2012
Sold by
Three A S Investments Llc
Bought by
Anderson Chard J
Purchase Details
Closed on
May 11, 2005
Sold by
Mccrady Andrew M and Mccrady Susan K
Bought by
Three As Investments Llc
Purchase Details
Closed on
May 16, 2001
Sold by
Mccrady Andrew and Mccrady Susan
Bought by
Mccrady Andrew M and Mccrady Susan K
Create a Home Valuation Report for This Property
The Home Valuation Report is an in-depth analysis detailing your home's value as well as a comparison with similar homes in the area
Home Values in the Area
Average Home Value in this Area
Purchase History
| Date | Buyer | Sale Price | Title Company |
|---|---|---|---|
| Rmhf Ii Series Llc | -- | Metro National Title | |
| Cragun Daniel R | -- | Intermountain Title Ins | |
| Anderson Chard J | -- | Inwest Title Services Inc | |
| Three As Investments Llc | -- | -- | |
| Mccrady Andrew M | -- | -- |
Source: Public Records
Tax History Compared to Growth
Tax History
| Year | Tax Paid | Tax Assessment Tax Assessment Total Assessment is a certain percentage of the fair market value that is determined by local assessors to be the total taxable value of land and additions on the property. | Land | Improvement |
|---|---|---|---|---|
| 2025 | $2,463 | $387,642 | $115,271 | $272,371 |
| 2024 | $2,403 | $381,000 | $115,272 | $265,728 |
| 2023 | $2,206 | $348,000 | $110,038 | $237,962 |
| 2022 | $2,412 | $217,800 | $52,604 | $165,196 |
| 2021 | $1,816 | $266,000 | $67,150 | $198,850 |
| 2020 | $1,683 | $226,000 | $67,150 | $158,850 |
| 2019 | $1,575 | $198,000 | $38,488 | $159,512 |
| 2018 | $1,470 | $173,000 | $34,658 | $138,342 |
| 2017 | $1,352 | $148,000 | $34,658 | $113,342 |
| 2016 | $1,364 | $80,766 | $18,206 | $62,560 |
| 2015 | $1,184 | $70,700 | $18,206 | $52,494 |
| 2014 | $1,141 | $66,947 | $15,484 | $51,463 |
Source: Public Records
Map
Nearby Homes