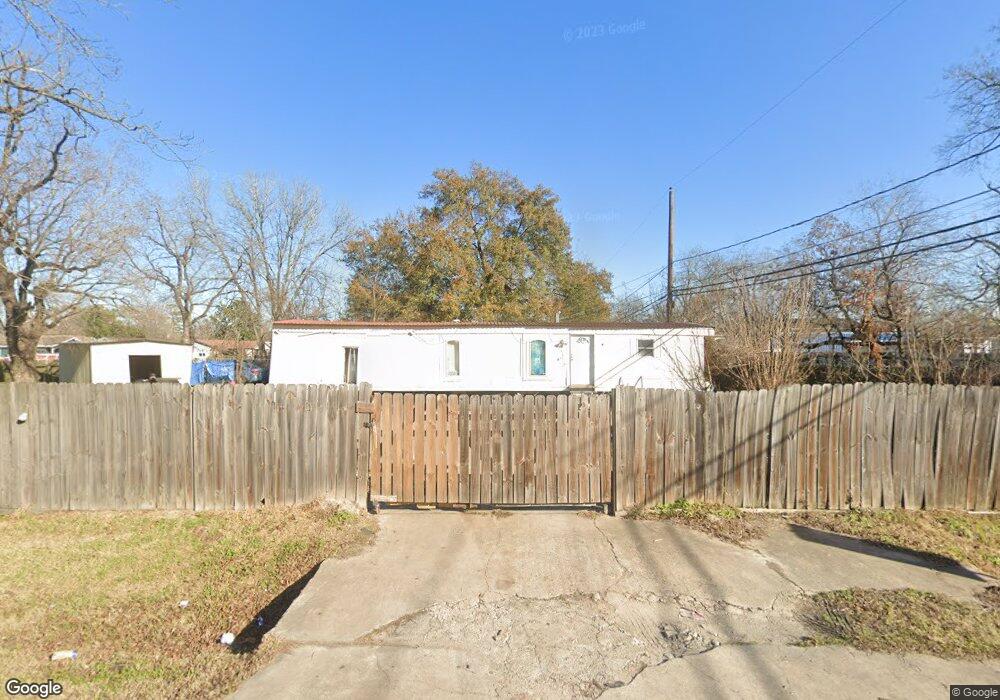
2422 Wardmont St Houston, TX 77093
East Aldine NeighborhoodEstimated Value: $74,369 - $190,000
3
Beds
1
Bath
1,150
Sq Ft
$138/Sq Ft
Est. Value
About This Home
This home is located at 2422 Wardmont St, Houston, TX 77093 and is currently estimated at $158,842, approximately $138 per square foot. 2422 Wardmont St is a home located in Harris County with nearby schools including Vardeman EC/PK/K, Worsham Elementary School, and Macarthur Ninth Grade School.
Ownership History
Date
Name
Owned For
Owner Type
Purchase Details
Closed on
Sep 26, 2013
Sold by
Luis Jose O and Garcia Fanceli
Bought by
Arrendondo Eventino M
Current Estimated Value
Purchase Details
Closed on
Jun 7, 2011
Sold by
The Bank Of New York Mellon
Bought by
Luis Jose O and Garcia Fanceli
Purchase Details
Closed on
Apr 18, 2011
Sold by
Groce Doyle Wayne and Groce Lee Collier
Bought by
The Bank Of New York Mellon
Purchase Details
Closed on
May 12, 2003
Sold by
Groce Doyle Wayne
Bought by
Groce Doyle Wayne and Groce Lee Collier
Purchase Details
Closed on
Mar 20, 1995
Sold by
Coats Herbert
Bought by
Groce Doyle
Home Financials for this Owner
Home Financials are based on the most recent Mortgage that was taken out on this home.
Original Mortgage
$32,450
Interest Rate
8.7%
Create a Home Valuation Report for This Property
The Home Valuation Report is an in-depth analysis detailing your home's value as well as a comparison with similar homes in the area
Home Values in the Area
Average Home Value in this Area
Purchase History
| Date | Buyer | Sale Price | Title Company |
|---|---|---|---|
| Arrendondo Eventino M | -- | None Available | |
| Luis Jose O | -- | Charter Title Company | |
| The Bank Of New York Mellon | $15,075 | None Available | |
| Groce Doyle Wayne | -- | -- | |
| Groce Doyle | -- | Title Agency #40 |
Source: Public Records
Mortgage History
| Date | Status | Borrower | Loan Amount |
|---|---|---|---|
| Previous Owner | Groce Doyle | $32,450 |
Source: Public Records
Tax History Compared to Growth
Tax History
| Year | Tax Paid | Tax Assessment Tax Assessment Total Assessment is a certain percentage of the fair market value that is determined by local assessors to be the total taxable value of land and additions on the property. | Land | Improvement |
|---|---|---|---|---|
| 2025 | $738 | $44,848 | $43,486 | $1,362 |
| 2024 | $738 | $44,848 | $43,486 | $1,362 |
| 2023 | $738 | $31,772 | $30,410 | $1,362 |
| 2022 | $265 | $31,772 | $30,410 | $1,362 |
| 2021 | $581 | $31,772 | $30,410 | $1,362 |
| 2020 | $694 | $31,772 | $30,410 | $1,362 |
| 2019 | $722 | $31,772 | $30,410 | $1,362 |
| 2018 | $229 | $15,959 | $14,597 | $1,362 |
| 2017 | $150 | $15,959 | $14,597 | $1,362 |
| 2016 | $362 | $15,959 | $14,597 | $1,362 |
| 2015 | $356 | $15,959 | $14,597 | $1,362 |
| 2014 | $356 | $15,959 | $14,597 | $1,362 |
Source: Public Records
Map
Nearby Homes
- 2326 Sunny Dr
- 2311 Warwick Rd
- 2306 Wardmont St
- 2237 Cromwell St
- 11746 Somerset Ln
- 11716 Innsbury Dr
- 2131 Cromwell St Unit D
- 2131 Warwick Rd
- 2123 Warwick Rd
- 2152 William Tell St
- 1925 Sunny Dr
- 2122 Kowis St
- 2817 Cromwell St
- 2629 Kowis St
- 1930 Cromwell St
- 2410 Mierianne St
- 2723 Castledale Dr
- 2915 Brea Crest St
- 2636 Lone Oak Rd
- 1703 & 0 Sunny Dr
- 2426 Wardmont St
- 2430 Wardmont St
- 2414 Wardmont St
- 2401 Hopper Rd
- 2405 Hopper Rd
- 2502 Wardmont St
- 2325 Hopper Rd
- 2423 Wardmont St
- 2410 Wardmont St
- 2419 Wardmont St
- 2415 Wardmont St
- 2321 Hopper Rd
- 2431 Wardmont St
- 2506 Wardmont St
- 2406 Wardmont St
- 2411 Wardmont St
- 2417 Hopper Rd
- 2503 Wardmont St
- 2317 Hopper Rd
- 2422 Sunny Dr