Estimated Value: $138,439 - $176,000
--
Bed
--
Bath
916
Sq Ft
$170/Sq Ft
Est. Value
About This Home
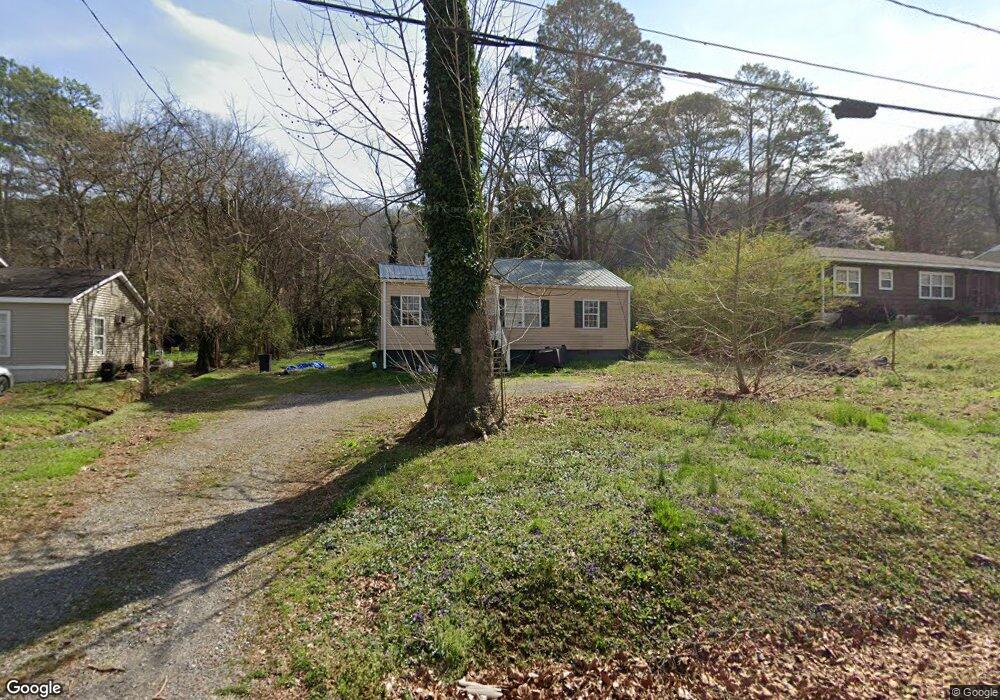
This home is located at 2423 Flannery St SE, Rome, GA 30161 and is currently estimated at $156,110, approximately $170 per square foot. 2423 Flannery St SE is a home located in Floyd County with nearby schools including Pepperell Middle School, Pepperell High School, and Montessori School of Rome.
Ownership History
Date
Name
Owned For
Owner Type
Purchase Details
Closed on
Aug 15, 2011
Sold by
Whelchel Alice C
Bought by
Merriman Michael Eddward
Current Estimated Value
Purchase Details
Closed on
Apr 12, 2006
Sold by
Not Provided
Bought by
Whelchel Alice C
Purchase Details
Closed on
Apr 7, 2005
Sold by
Lewis Melissa
Bought by
Lewis Melissa and Lewis Kenneth Kevin
Purchase Details
Closed on
Apr 6, 2004
Sold by
Moore Clyde E and Moore Toni R
Bought by
Wells Fargo Bank Na F/K/A Wells Fargo Ba
Purchase Details
Closed on
Jul 15, 2002
Sold by
Moore Clyde E
Bought by
Moore Clyde E and Moore Toni R
Purchase Details
Closed on
Sep 24, 1981
Sold by
Crabbe Danny W and Crabbe Yvonne W
Bought by
Moore Clyde E
Purchase Details
Closed on
Apr 14, 1969
Sold by
P\R
Bought by
Crabbe Danny W and Crabbe Yvonne W
Purchase Details
Closed on
Jan 16, 1969
Sold by
Parris Dewey F
Bought by
P\R
Purchase Details
Closed on
Oct 21, 1968
Sold by
Walker John A
Bought by
Parris Dewey F
Purchase Details
Closed on
Jan 1, 1901
Bought by
Walker John A
Create a Home Valuation Report for This Property
The Home Valuation Report is an in-depth analysis detailing your home's value as well as a comparison with similar homes in the area
Home Values in the Area
Average Home Value in this Area
Purchase History
| Date | Buyer | Sale Price | Title Company |
|---|---|---|---|
| Merriman Michael Eddward | -- | -- | |
| Whelchel Alice C | $72,000 | -- | |
| Lewis Melissa | -- | -- | |
| Lewis Melissa | $23,500 | -- | |
| Wells Fargo Bank Na F/K/A Wells Fargo Ba | $48,800 | -- | |
| Moore Clyde E | -- | -- | |
| Moore Clyde E | $22,000 | -- | |
| Crabbe Danny W | $95,000 | -- | |
| P\R | -- | -- | |
| Parris Dewey F | $1,000 | -- | |
| Walker John A | -- | -- |
Source: Public Records
Tax History Compared to Growth
Tax History
| Year | Tax Paid | Tax Assessment Tax Assessment Total Assessment is a certain percentage of the fair market value that is determined by local assessors to be the total taxable value of land and additions on the property. | Land | Improvement |
|---|---|---|---|---|
| 2024 | $1,492 | $47,906 | $8,640 | $39,266 |
| 2023 | $1,371 | $45,231 | $7,680 | $37,551 |
| 2022 | $1,106 | $37,276 | $6,400 | $30,876 |
| 2021 | $939 | $31,101 | $6,400 | $24,701 |
| 2020 | $866 | $28,452 | $4,800 | $23,652 |
| 2019 | $728 | $24,234 | $4,800 | $19,434 |
| 2018 | $699 | $23,228 | $4,800 | $18,428 |
| 2017 | $686 | $22,761 | $4,800 | $17,961 |
| 2016 | $731 | $23,970 | $4,800 | $19,170 |
| 2015 | $715 | $23,970 | $4,800 | $19,170 |
| 2014 | $715 | $23,970 | $4,800 | $19,170 |
Source: Public Records
Map
Nearby Homes
- 107 E Linden St SE
- 2501 Maple Rd SE
- 2508 Maple Rd SE
- 2523 Maple Rd SE
- 2107 Rockmart Rd SE
- 211 Alfred Ave SE
- 212 Alfred Ave SE
- 36 Saddle Mountain Rd SE
- 2108 Maple Ave SW
- 7 Willingham St SW
- 3 Belmont Ct SE
- 15 Saddlebrook Dr SE
- 0 Martha Berry Hwy Unit 7525627
- 0 Martha Berry Hwy Unit 7614774
- 0 Martha Berry Hwy Unit 10563404
- 2710 Maple Rd SE
- 109 Chateau Dr SE
- 105 Chateau Dr SE
- 111 Hosea St SW
- 14 Clover St SW
- 2425 Flannery St SE
- 2421 Flannery St SE
- 22 Rosemont Dr SE
- 2427 Flannery St SE
- 2419 Flannery St SE
- 123 Hawthorne St SE
- 24 Rosemont Dr SE
- 20 Rosemont Dr SE
- 124 E Linden St SE
- 26 Rosemont Dr SE
- 18 Rosemont Dr SE
- 2429 Flannery St SE
- 123 Hawthorn St
- 121 Hawthorne St SE
- 122 E Linden St SE
- 28 Rosemont Dr SE
- 122 Hawthorne St SE
- 2415 Flannery St SE
- 2431 Flannery St SE
- 120 Hawthorne St SE