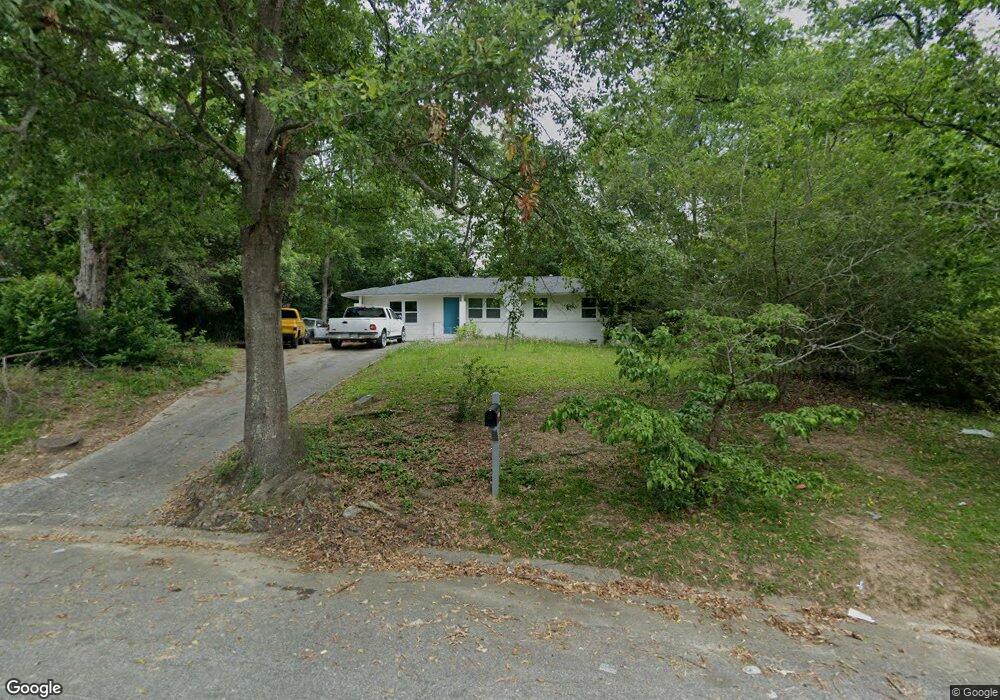
2423 Rosen Ave Macon, GA 31206
Estimated Value: $96,000 - $102,000
3
Beds
1
Bath
810
Sq Ft
$123/Sq Ft
Est. Value
About This Home
This home is located at 2423 Rosen Ave, Macon, GA 31206 and is currently estimated at $99,610, approximately $122 per square foot. 2423 Rosen Ave is a home located in Bibb County with nearby schools including Southfield Elementary School, Southwest High School, and Gilead Christian Academy.
Ownership History
Date
Name
Owned For
Owner Type
Purchase Details
Closed on
Jul 18, 2022
Sold by
Lunsford Family Properties Llc
Bought by
Greenflower 22A Llc
Current Estimated Value
Home Financials for this Owner
Home Financials are based on the most recent Mortgage that was taken out on this home.
Original Mortgage
$7,349,500
Outstanding Balance
$5,401,569
Interest Rate
5.7%
Mortgage Type
New Conventional
Estimated Equity
-$5,301,959
Purchase Details
Closed on
Jul 17, 2020
Sold by
Liberty Housing Solutions Llc
Bought by
Sre Dnd Holdings Llc
Purchase Details
Closed on
Jul 10, 2008
Sold by
Brannan Ann I and Booth Ann I
Bought by
Mahco Investments Llc
Home Financials for this Owner
Home Financials are based on the most recent Mortgage that was taken out on this home.
Original Mortgage
$20,625
Interest Rate
6.27%
Mortgage Type
Purchase Money Mortgage
Create a Home Valuation Report for This Property
The Home Valuation Report is an in-depth analysis detailing your home's value as well as a comparison with similar homes in the area
Home Values in the Area
Average Home Value in this Area
Purchase History
| Date | Buyer | Sale Price | Title Company |
|---|---|---|---|
| Greenflower 22A Llc | -- | None Listed On Document | |
| Sre Dnd Holdings Llc | $88,800 | None Available | |
| Liberty Housing Solutions Llc | $100,000 | None Available | |
| Mahco Investments Llc | $27,500 | None Available |
Source: Public Records
Mortgage History
| Date | Status | Borrower | Loan Amount |
|---|---|---|---|
| Open | Greenflower 22A Llc | $7,349,500 | |
| Previous Owner | Mahco Investments Llc | $20,625 |
Source: Public Records
Tax History Compared to Growth
Tax History
| Year | Tax Paid | Tax Assessment Tax Assessment Total Assessment is a certain percentage of the fair market value that is determined by local assessors to be the total taxable value of land and additions on the property. | Land | Improvement |
|---|---|---|---|---|
| 2025 | $938 | $38,155 | $2,800 | $35,355 |
| 2024 | $661 | $26,018 | $2,800 | $23,218 |
| 2023 | $565 | $22,228 | $1,120 | $21,108 |
| 2022 | $486 | $14,048 | $1,538 | $12,510 |
| 2021 | $367 | $9,645 | $1,384 | $8,261 |
| 2020 | $329 | $8,465 | $1,384 | $7,081 |
| 2019 | $331 | $8,465 | $1,384 | $7,081 |
| 2018 | $541 | $6,027 | $1,307 | $4,720 |
| 2017 | $226 | $6,027 | $1,307 | $4,720 |
| 2016 | $209 | $6,028 | $1,307 | $4,720 |
| 2015 | $295 | $6,028 | $1,307 | $4,720 |
| 2014 | $595 | $10,568 | $2,307 | $8,261 |
Source: Public Records
Map
Nearby Homes
- 2415 Rosen Ave
- 4403 Vinson Ave
- 4361 Vinson Ave
- 4415 Vinson Ave
- 2408 Holland Dr
- 2439 Rosen Ave
- 2430 Rosen Ave
- 2416 Holland Dr
- 2405 Rosen Ave
- 2400 Holland Dr
- 4425 Vinson Ave
- 2424 Holland Dr
- 2427 Hillside Dr
- 0 Vinson Ave Unit 7601498
- 0 Vinson Ave Unit 7167905
- 0 Vinson Ave Unit 7051303
- 2447 Rosen Ave
- 2448 Rosen Ave
- 4400 Vinson Ave
- 2432 Holland Dr