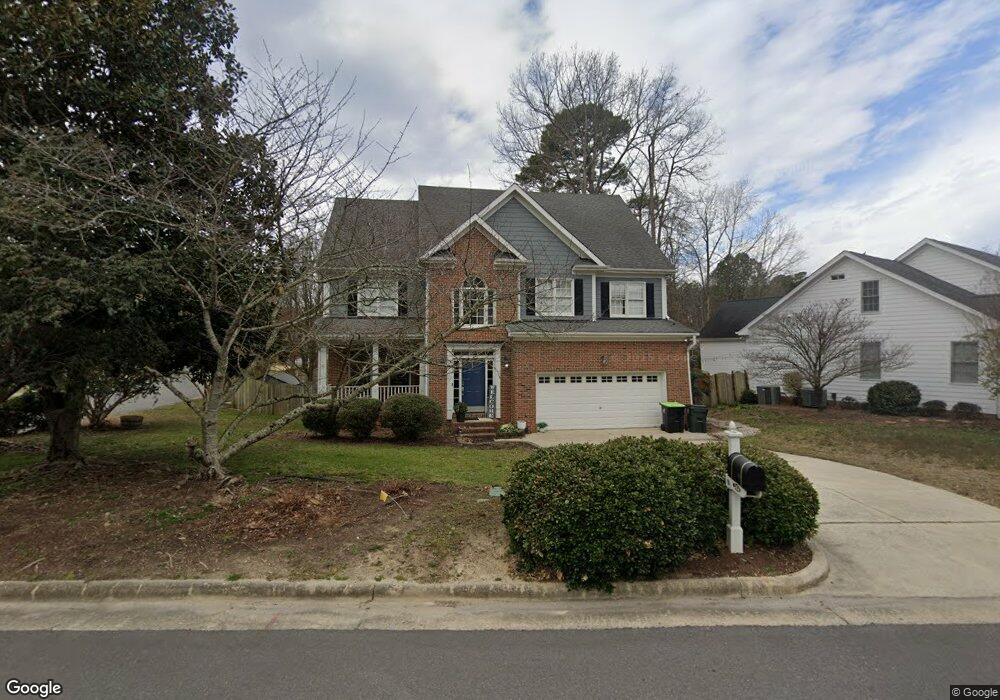
2424 Bristers Spring Way Apex, NC 27523
Beaver Creek NeighborhoodEstimated Value: $763,525 - $838,000
6
Beds
4
Baths
3,568
Sq Ft
$222/Sq Ft
Est. Value
About This Home
This home is located at 2424 Bristers Spring Way, Apex, NC 27523 and is currently estimated at $791,381, approximately $221 per square foot. 2424 Bristers Spring Way is a home located in Wake County with nearby schools including Turner Creek Elementary School, Salem Middle, and Green Level High School.
Ownership History
Date
Name
Owned For
Owner Type
Purchase Details
Closed on
Oct 3, 2012
Sold by
Moore Lara M and Moore Malcolm C
Bought by
Perla Deane A
Current Estimated Value
Home Financials for this Owner
Home Financials are based on the most recent Mortgage that was taken out on this home.
Original Mortgage
$295,200
Outstanding Balance
$194,444
Interest Rate
2.5%
Mortgage Type
Adjustable Rate Mortgage/ARM
Estimated Equity
$596,937
Purchase Details
Closed on
Nov 17, 2009
Sold by
Holt Jon and Holt Heather A
Bought by
Moore Lara M and Moore Malcolm C
Purchase Details
Closed on
Apr 19, 2001
Sold by
Orchard Home Corp
Bought by
Moore Malcolm C and Moore Lara M
Home Financials for this Owner
Home Financials are based on the most recent Mortgage that was taken out on this home.
Original Mortgage
$226,000
Interest Rate
6.99%
Create a Home Valuation Report for This Property
The Home Valuation Report is an in-depth analysis detailing your home's value as well as a comparison with similar homes in the area
Home Values in the Area
Average Home Value in this Area
Purchase History
| Date | Buyer | Sale Price | Title Company |
|---|---|---|---|
| Perla Deane A | $369,000 | None Available | |
| Moore Lara M | -- | None Available | |
| Moore Malcolm C | $282,500 | -- |
Source: Public Records
Mortgage History
| Date | Status | Borrower | Loan Amount |
|---|---|---|---|
| Open | Perla Deane A | $295,200 | |
| Previous Owner | Moore Malcolm C | $226,000 |
Source: Public Records
Tax History Compared to Growth
Tax History
| Year | Tax Paid | Tax Assessment Tax Assessment Total Assessment is a certain percentage of the fair market value that is determined by local assessors to be the total taxable value of land and additions on the property. | Land | Improvement |
|---|---|---|---|---|
| 2025 | $256 | $680,595 | $220,000 | $460,595 |
| 2024 | $2,929 | $680,595 | $220,000 | $460,595 |
| 2023 | $4,710 | $427,492 | $85,000 | $342,492 |
| 2022 | $4,421 | $427,492 | $85,000 | $342,492 |
| 2021 | $4,252 | $427,492 | $85,000 | $342,492 |
| 2020 | $4,209 | $427,492 | $85,000 | $342,492 |
| 2019 | $4,420 | $387,399 | $80,000 | $307,399 |
| 2018 | $4,163 | $387,399 | $80,000 | $307,399 |
| 2017 | $3,875 | $387,399 | $80,000 | $307,399 |
| 2016 | $3,818 | $387,399 | $80,000 | $307,399 |
| 2015 | $3,840 | $380,280 | $70,000 | $310,280 |
| 2014 | -- | $380,280 | $70,000 | $310,280 |
Source: Public Records
Map
Nearby Homes
- 2208 Good Shepherd Way
- 2122 Grouse Ski Cir
- 2115 Grouse Ski Cir
- 1622 Shepherds Glade Dr
- 2134 Grouse Ski Cir
- 2127 Grouse Ski Cir
- 1633 Shepherds Glade Dr
- 831 Tunisian Dr
- 7242 Morris Acres Rd
- 2300 Walden Creek Dr
- 2060 Jersey City Place
- 2201 Dial Dr
- 2126 Whitesmith Dr
- 479 Clark Creek Ln
- 1001 Drayman Place
- 1038 Brownsmith Dr
- 2007 Ackerman Hill Dr
- 553 Duggins Point
- 2013 Keokuk Ct
- 1117 Palisade Bluff Ln Unit Lot 43
- 2422 Bristers Spring Way
- 2404 Walden Creek Dr
- 2405 Poets Corner Ct
- 2401 Walden Creek Dr
- 2403 Walden Creek Dr
- 2423 Bristers Spring Way
- 2500 Walden Woods Dr
- 2419 Bristers Spring Way
- 2329 Walden Creek Dr
- 2407 Walden Creek Dr
- 2407 Poets Corner Ct
- 2402 Poets Corner Ct
- 2418 Bristers Spring Way
- 2408 Rabbit Walk Ln
- 2502 Walden Woods Dr
- 2328 Walden Creek Dr
- 2404 Poets Corner Ct
- 2406 Poets Corner Ct
- 2413 Bristers Spring Way
- 2406 Rabbit Walk Ln