Estimated Value: $179,000 - $409,000
4
Beds
2
Baths
1,332
Sq Ft
$217/Sq Ft
Est. Value
About This Home
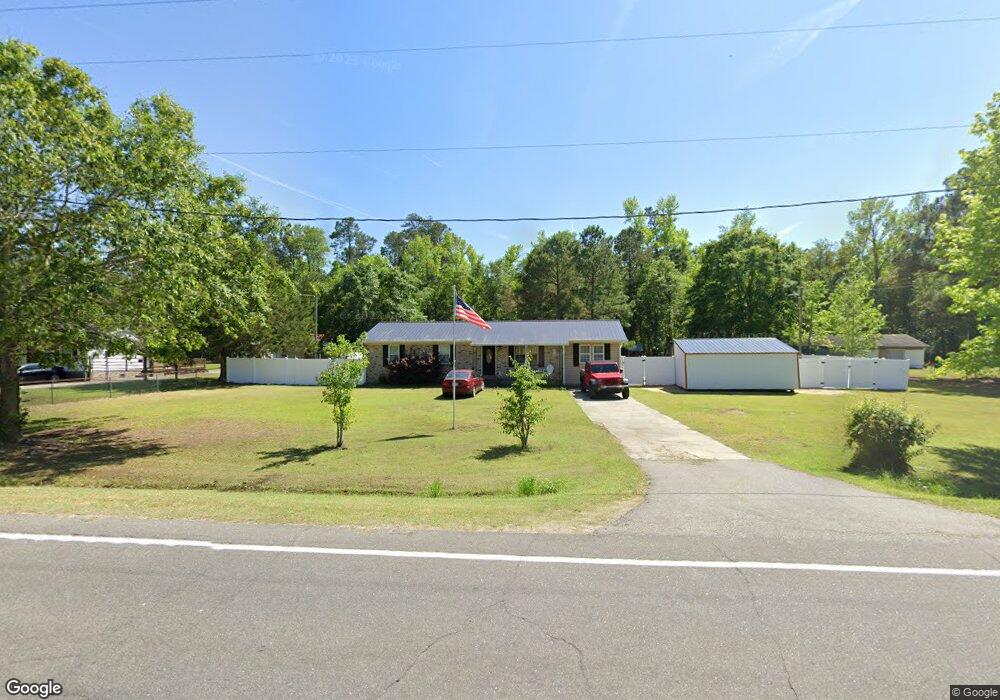
This home is located at 2424 Highway 319, Aynor, SC 29511 and is currently estimated at $288,542, approximately $216 per square foot. 2424 Highway 319 is a home with nearby schools including Midland Elementary School, Aynor Middle School, and Aynor High School.
Ownership History
Date
Name
Owned For
Owner Type
Purchase Details
Closed on
Jun 14, 2021
Sold by
Wilson Landon Jay
Bought by
Keeling Irene K and Keeling Carson R
Current Estimated Value
Purchase Details
Closed on
Mar 17, 2016
Sold by
Launcher Ptshp
Bought by
Wilson Landon J
Home Financials for this Owner
Home Financials are based on the most recent Mortgage that was taken out on this home.
Original Mortgage
$123,000
Interest Rate
3.65%
Purchase Details
Closed on
Oct 13, 2015
Bought by
Launcher Ptshp
Purchase Details
Closed on
Jun 30, 2010
Sold by
Johnson Jay
Bought by
Cox James R
Purchase Details
Closed on
Jul 15, 2008
Sold by
Brown Donald I
Bought by
Johnson Jay
Purchase Details
Closed on
Apr 26, 2007
Sold by
Skipper Johnny W
Bought by
Holliday Associates Llc
Purchase Details
Closed on
May 22, 2006
Sold by
Marroc Properties Inc
Bought by
Skipper Johnny W
Purchase Details
Closed on
May 16, 2006
Sold by
U S Bank Na
Bought by
Marroc Properties Inc
Create a Home Valuation Report for This Property
The Home Valuation Report is an in-depth analysis detailing your home's value as well as a comparison with similar homes in the area
Home Values in the Area
Average Home Value in this Area
Purchase History
| Date | Buyer | Sale Price | Title Company |
|---|---|---|---|
| Keeling Irene K | $145,900 | -- | |
| Wilson Landon J | $123,000 | -- | |
| Launcher Ptshp | $78,201 | -- | |
| Cox James R | $108,000 | -- | |
| Johnson Jay | $89,100 | -- | |
| Holliday Associates Llc | $205,000 | None Available | |
| Skipper Johnny W | $110,350 | None Available | |
| Marroc Properties Inc | $105,000 | None Available |
Source: Public Records
Mortgage History
| Date | Status | Borrower | Loan Amount |
|---|---|---|---|
| Previous Owner | Wilson Landon J | $123,000 |
Source: Public Records
Tax History Compared to Growth
Tax History
| Year | Tax Paid | Tax Assessment Tax Assessment Total Assessment is a certain percentage of the fair market value that is determined by local assessors to be the total taxable value of land and additions on the property. | Land | Improvement |
|---|---|---|---|---|
| 2024 | $871 | $16,417 | $4,532 | $11,885 |
| 2023 | $871 | $3,505 | $739 | $2,766 |
| 2021 | $712 | $6,748 | $1,180 | $5,568 |
| 2020 | $350 | $6,748 | $1,180 | $5,568 |
| 2019 | $350 | $6,748 | $1,180 | $5,568 |
| 2018 | $0 | $4,572 | $990 | $3,582 |
| 2017 | $303 | $4,572 | $990 | $3,582 |
| 2016 | -- | $4,572 | $990 | $3,582 |
| 2015 | $1,001 | $4,572 | $990 | $3,582 |
| 2014 | $969 | $4,572 | $990 | $3,582 |
Source: Public Records
Map
Nearby Homes
- 1768 Vereen Rd
- 1762 Vereen Rd Unit Lot 5 - Live Oak
- 1754 Vereen Rd
- 0 Nichols Hwy Unit 2517677
- TBD Kc Ln Unit Lot 7
- TBD Kc Ln Unit Lot 8
- TBD Kc Ln Unit Lot 6
- TBD Kc Ln Unit Lot 9
- TBD Highway 501 W
- TBD J H Martin Rd
- TBD Salem Rd
- 111 Quigley Place
- 568 Rosedale Dr
- 112 Quigley Place
- 118 Quigley Place
- 2292 Nichols Hwy
- 204 Rosedale Dr
- 168 Rosedale Dr
- 388 William Nobles Rd Unit Lot 10 - Live Oak
- 380 William Nobles Rd Unit Lot 6 - Magnolia
- 2436 Highway 319
- 2433 Highway 319
- 2460 Highway 319
- 2425 Highway 319
- 2412 S Carolina 319
- 2475 Highway 319
- 2413 Highway 319
- 2476 Highway 319
- 2400 Highway 319
- 2475 Gore Rd
- 2390 Highway 319
- Lot 6 & 7 Highway 319
- 2370 Highway 319
- 2490 Highway 319
- Lot 8 Highway 319
- 2350 Highway 319
- Lot 3 Gore Rd
- TBD Gore Rd
- TBD Gore Rd Unit Tract C-1
- TBD Gore Rd Unit Tract B-1