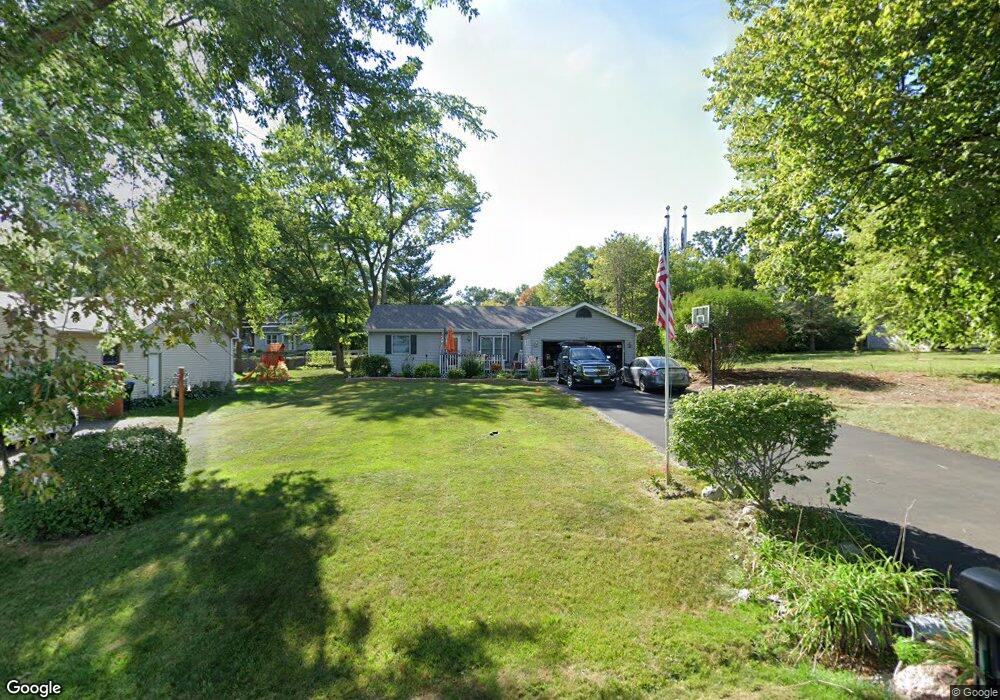
2424 N Spojnia Rd McHenry, IL 60050
Estimated Value: $216,000 - $291,000
3
Beds
1
Bath
1,500
Sq Ft
$176/Sq Ft
Est. Value
About This Home
This home is located at 2424 N Spojnia Rd, McHenry, IL 60050 and is currently estimated at $264,148, approximately $176 per square foot. 2424 N Spojnia Rd is a home located in McHenry County with nearby schools including Valley View Elementary School, Parkland School, and McHenry Community High School - Upper Campus.
Ownership History
Date
Name
Owned For
Owner Type
Purchase Details
Closed on
May 2, 2023
Sold by
King William P
Bought by
William King Revocable Trust and Susan King Revocable Trust
Current Estimated Value
Purchase Details
Closed on
Apr 29, 2015
Sold by
Lennon Cheryl M
Bought by
King William P and King Susan M
Home Financials for this Owner
Home Financials are based on the most recent Mortgage that was taken out on this home.
Original Mortgage
$72,000
Interest Rate
4.62%
Mortgage Type
New Conventional
Purchase Details
Closed on
Jan 12, 1998
Sold by
Schneider Steve
Bought by
Lennon Cheryl M
Home Financials for this Owner
Home Financials are based on the most recent Mortgage that was taken out on this home.
Original Mortgage
$121,800
Interest Rate
7.26%
Mortgage Type
FHA
Purchase Details
Closed on
Aug 30, 1997
Sold by
Klim Mary and Trejgo Joanne
Bought by
Schneider Steve
Create a Home Valuation Report for This Property
The Home Valuation Report is an in-depth analysis detailing your home's value as well as a comparison with similar homes in the area
Home Values in the Area
Average Home Value in this Area
Purchase History
| Date | Buyer | Sale Price | Title Company |
|---|---|---|---|
| William King Revocable Trust | -- | None Listed On Document | |
| King William P | $90,000 | Attorney | |
| Lennon Cheryl M | $124,500 | -- | |
| Schneider Steve | $24,500 | Atty National Title |
Source: Public Records
Mortgage History
| Date | Status | Borrower | Loan Amount |
|---|---|---|---|
| Previous Owner | King William P | $72,000 | |
| Previous Owner | Lennon Cheryl M | $121,800 |
Source: Public Records
Tax History Compared to Growth
Tax History
| Year | Tax Paid | Tax Assessment Tax Assessment Total Assessment is a certain percentage of the fair market value that is determined by local assessors to be the total taxable value of land and additions on the property. | Land | Improvement |
|---|---|---|---|---|
| 2024 | $5,220 | $65,269 | $9,004 | $56,265 |
| 2023 | $5,100 | $58,475 | $8,067 | $50,408 |
| 2022 | $4,472 | $49,998 | $7,484 | $42,514 |
| 2021 | $4,273 | $46,562 | $6,970 | $39,592 |
| 2020 | $3,968 | $42,750 | $6,679 | $36,071 |
| 2019 | $3,919 | $40,594 | $6,342 | $34,252 |
| 2018 | $4,170 | $38,753 | $6,054 | $32,699 |
| 2017 | $4,024 | $36,371 | $5,682 | $30,689 |
| 2016 | $3,913 | $33,991 | $5,310 | $28,681 |
| 2013 | -- | $33,466 | $5,228 | $28,238 |
Source: Public Records
Map
Nearby Homes
- 2519 N Ringwood Rd
- 5115 Maple Hill Dr
- 5625 Chesapeake Dr Unit 5625
- 5108 Shorehill Dr
- 1911 Highview Ave
- 5003 Parkview Dr
- 1807 Beach Rd
- 5014 Willow Ln
- 5107 Willow Ln Unit 3
- 4713 Mccullom Lake Rd
- 4910 Willow Ln
- 5811 Whiting Dr
- 4708 Willow Ln
- 6275 Maple Glen Dr
- 6114 Whiteoak Dr
- LOT 1 Lakeside Ct
- 6277 Maple Glen Dr
- 2526 Redwood Trail
- 5101 W Elm St
- 1612 Knoll Ave
- 2422 N Spojnia Rd
- 2420 N Spojnia Rd
- 2408 N Spojnia Rd
- 5318 W Woodland Dr
- 2418 N Spojnia Rd
- 5318 W Highland Dr
- 5320 W Woodland Dr
- 2427 Beachside Rd
- 5320 W Highland Dr
- 5301 W Woodland Dr
- 5322 W Woodland Dr
- 5402 W Highland Dr
- 2411 Beachside Rd
- 2500 N Spojnia Rd
- 5404 W Woodland Dr
- 2406 N Spojnia Rd
- 5403 W Woodland Dr
- 5406 W Highland Dr
- 5406 W Highland Dr
- 5319 W Highland Dr