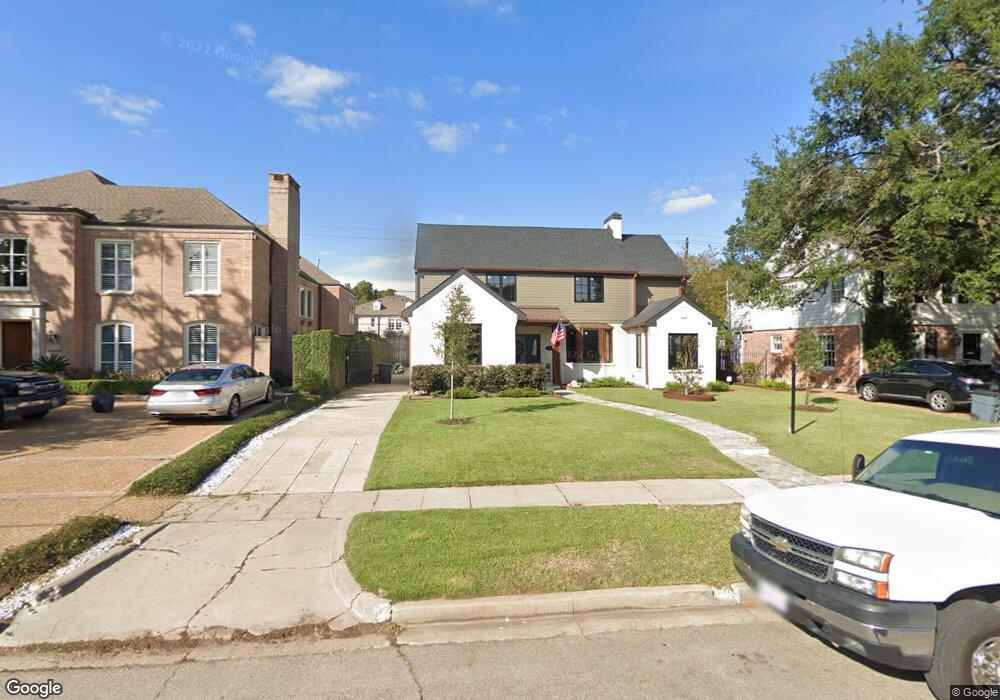
2424 Pelham Dr Houston, TX 77019
River Oaks NeighborhoodEstimated Value: $2,274,000 - $3,389,000
4
Beds
4
Baths
3,141
Sq Ft
$893/Sq Ft
Est. Value
About This Home
This home is located at 2424 Pelham Dr, Houston, TX 77019 and is currently estimated at $2,806,447, approximately $893 per square foot. 2424 Pelham Dr is a home located in Harris County with nearby schools including River Oaks Elementary School, Lanier Middle School, and Lamar High School.
Ownership History
Date
Name
Owned For
Owner Type
Purchase Details
Closed on
Feb 21, 2020
Sold by
Kaasmeyer Ashley Dierker and Kaasmeyer Criag Wayne
Bought by
Davis Joshua P and Davis Afsheen S
Current Estimated Value
Home Financials for this Owner
Home Financials are based on the most recent Mortgage that was taken out on this home.
Original Mortgage
$1,357,600
Outstanding Balance
$1,209,712
Interest Rate
3.6%
Mortgage Type
New Conventional
Estimated Equity
$1,606,145
Purchase Details
Closed on
Aug 19, 2013
Sold by
Watlers Priscilla F and Angle Brent
Bought by
Klaasmeyer Ashley Dierker and Klaasmeyer Craig Wayne
Purchase Details
Closed on
Dec 16, 1996
Sold by
Rush Interests Inc
Bought by
Walters Priscilla F
Home Financials for this Owner
Home Financials are based on the most recent Mortgage that was taken out on this home.
Original Mortgage
$250,000
Interest Rate
7.71%
Create a Home Valuation Report for This Property
The Home Valuation Report is an in-depth analysis detailing your home's value as well as a comparison with similar homes in the area
Home Values in the Area
Average Home Value in this Area
Purchase History
| Date | Buyer | Sale Price | Title Company |
|---|---|---|---|
| Davis Joshua P | -- | Old Republic Natl Ttl Ins Co | |
| Klaasmeyer Ashley Dierker | -- | Old Republic National Title | |
| Walters Priscilla F | -- | Commonwealth Land Title Co |
Source: Public Records
Mortgage History
| Date | Status | Borrower | Loan Amount |
|---|---|---|---|
| Open | Davis Joshua P | $1,357,600 | |
| Previous Owner | Walters Priscilla | $226,800 | |
| Previous Owner | Walters Priscilla F | $250,000 |
Source: Public Records
Tax History Compared to Growth
Tax History
| Year | Tax Paid | Tax Assessment Tax Assessment Total Assessment is a certain percentage of the fair market value that is determined by local assessors to be the total taxable value of land and additions on the property. | Land | Improvement |
|---|---|---|---|---|
| 2024 | $39,140 | $2,637,408 | $1,286,500 | $1,350,908 |
| 2023 | $39,140 | $2,169,099 | $1,245,000 | $924,099 |
| 2022 | $43,443 | $1,972,994 | $1,203,500 | $769,494 |
| 2021 | $39,618 | $1,699,847 | $1,120,500 | $579,347 |
| 2020 | $37,157 | $1,534,421 | $1,120,500 | $413,921 |
| 2019 | $38,755 | $1,531,547 | $1,120,500 | $411,047 |
| 2018 | $38,541 | $1,523,091 | $1,079,000 | $444,091 |
| 2017 | $38,512 | $1,523,091 | $1,079,000 | $444,091 |
| 2016 | $40,080 | $1,585,091 | $1,141,000 | $444,091 |
| 2015 | $35,491 | $1,544,341 | $1,100,250 | $444,091 |
| 2014 | $35,491 | $1,380,608 | $937,250 | $443,358 |
Source: Public Records
Map
Nearby Homes
- 2418 Stanmore Dr
- 2249 Pelham Dr
- 2525 Inwood Dr
- 2233 Pelham Dr
- 2217 Pelham Dr
- 2323 San Felipe St Unit 1101
- 2323 San Felipe St Unit 602
- 2323 San Felipe St Unit 901
- 2323 San Felipe St Unit 501
- 1913 Revere St
- 2413 Brentwood Dr
- 1561 Kirby Dr
- 1915 Kirby Dr
- 2207 Stanmore Dr
- 2221 Welch St Unit 401
- 2240 Mimosa Dr Unit 3N
- 2240 Mimosa Dr Unit PH-8W
- 2240 Mimosa Dr Unit 6E
- 2240 Mimosa Dr Unit 4N
- 2240 Mimosa Dr Unit 5W
- 2418 Pelham Dr
- 2428 Pelham Dr
- 2414 Pelham Dr
- 2434 Pelham Dr
- 2425 Del Monte Dr
- 2431 Del Monte Dr
- 2419 Del Monte Dr
- 2435 Del Monte Dr
- 2423 Pelham Dr
- 2417 Pelham Dr
- 2408 Pelham Dr
- 2438 Pelham Dr
- 2427 Pelham Dr
- 2413 Del Monte Dr
- 2413 Pelham Dr
- 2441 Del Monte Dr
- 2407 Pelham Dr
- 2442 Pelham Dr
- 2404 Pelham Dr
- 2409 Del Monte Dr