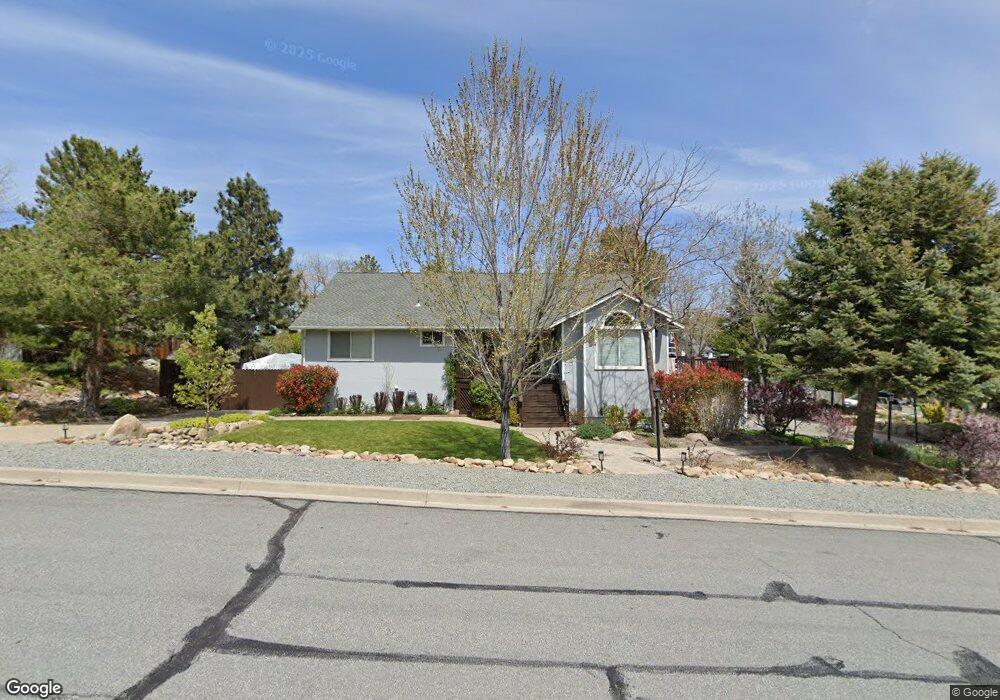
2425 Solitude Dr Unit 4 Reno, NV 89511
Summit Sierra NeighborhoodEstimated Value: $764,627 - $897,000
3
Beds
2
Baths
2,052
Sq Ft
$408/Sq Ft
Est. Value
About This Home
This home is located at 2425 Solitude Dr Unit 4, Reno, NV 89511 and is currently estimated at $837,407, approximately $408 per square foot. 2425 Solitude Dr Unit 4 is a home located in Washoe County with nearby schools including Ted Hunsburger Elementary School, Marce Herz Middle School, and Galena High School.
Ownership History
Date
Name
Owned For
Owner Type
Purchase Details
Closed on
Mar 31, 2010
Sold by
Reed Richard B and Reed Cynthia M
Bought by
Reed Richard B and Reed Cynthia M
Current Estimated Value
Purchase Details
Closed on
Feb 5, 2002
Sold by
Tiernan S Gregory and Tiernan Virginia R
Bought by
Reed Richard B and Reed Cynthia M
Home Financials for this Owner
Home Financials are based on the most recent Mortgage that was taken out on this home.
Original Mortgage
$215,200
Outstanding Balance
$86,092
Interest Rate
7.04%
Estimated Equity
$751,315
Purchase Details
Closed on
May 14, 2001
Sold by
Osmetti Cindy Owens
Bought by
Tiernan S Gregory and Tiernan Virginia R
Purchase Details
Closed on
Dec 24, 1997
Sold by
Owens David
Bought by
Owens Cindy
Purchase Details
Closed on
Dec 17, 1993
Sold by
Galena Country Estates Partnership
Bought by
Owens David and Owens Cindy
Create a Home Valuation Report for This Property
The Home Valuation Report is an in-depth analysis detailing your home's value as well as a comparison with similar homes in the area
Home Values in the Area
Average Home Value in this Area
Purchase History
| Date | Buyer | Sale Price | Title Company |
|---|---|---|---|
| Reed Richard B | -- | None Available | |
| Reed Richard B | $269,000 | First Centennial Title Co | |
| Tiernan S Gregory | $232,000 | First Centennial Title Co | |
| Osmetti Cindy Owens | -- | First Centennial Title Co | |
| Owens Cindy | -- | -- | |
| Owens David | $46,000 | Stewart Title |
Source: Public Records
Mortgage History
| Date | Status | Borrower | Loan Amount |
|---|---|---|---|
| Open | Reed Richard B | $215,200 |
Source: Public Records
Tax History
| Year | Tax Paid | Tax Assessment Tax Assessment Total Assessment is a certain percentage of the fair market value that is determined by local assessors to be the total taxable value of land and additions on the property. | Land | Improvement |
|---|---|---|---|---|
| 2026 | $2,447 | $141,774 | $65,450 | $76,324 |
| 2024 | $3,175 | $138,509 | $59,395 | $79,114 |
| 2023 | $3,087 | $136,910 | $61,705 | $75,205 |
| 2022 | $2,996 | $110,668 | $47,705 | $62,963 |
| 2021 | $2,909 | $97,636 | $34,755 | $62,881 |
| 2020 | $2,784 | $101,750 | $38,500 | $63,250 |
| 2019 | $2,704 | $95,825 | $34,930 | $60,895 |
| 2018 | $2,625 | $85,447 | $25,690 | $59,757 |
| 2017 | $2,542 | $81,630 | $21,595 | $60,035 |
| 2016 | $2,478 | $84,827 | $23,275 | $61,552 |
| 2015 | $2,473 | $80,230 | $18,550 | $61,680 |
| 2014 | $2,401 | $75,238 | $15,540 | $59,698 |
| 2013 | -- | $71,919 | $13,370 | $58,549 |
Source: Public Records
Map
Nearby Homes
- 409 Solitude Ct
- 1770 Kodiak Cir
- 3640 Aspen Hollow
- 735 Summer Star Place
- 14535 S Quiet Meadow Dr
- 2220 Whites Creek Ln
- 15509 Quicksilver Dr
- 4447 White Fish Dr
- 1200 Springer Ct
- 14240 Bandolier Ct
- 1235 Springer Ct
- 17000 Wedge Pkwy Unit 1722
- 17000 Wedge Pkwy Unit 1911
- 17000 Wedge Pkwy Unit 425
- 17000 Wedge Pkwy Unit 2625
- 16070 River Oaks Ct
- 14330 E Windriver Ln
- 40 Day Lily Ct
- 14315 W Windriver Ln
- 12910 Silver Wolf Rd
- 2425 Telluride Dr
- 2445 Telluride Dr
- 2415 Telluride Dr
- 2430 Telluride Dr
- 2455 Telluride Dr Unit 4
- 2430 Solitude Dr
- 2445 Solitude Dr
- 30 Telluride Ct
- 2450 Telluride Dr
- 20 Telluride Ct
- 2395 Solitude Dr
- 2440 Solitude Dr
- 2420 Telluride Dr
- 2465 Telluride Dr
- 40 Telluride Ct Unit 4
- 2390 Solitude Dr
- 2410 Telluride Dr
- 2450 Solitude Dr
- 2465 Solitude Dr Unit 6
- 2385 Solitude Dr
Your Personal Tour Guide
Ask me questions while you tour the home.