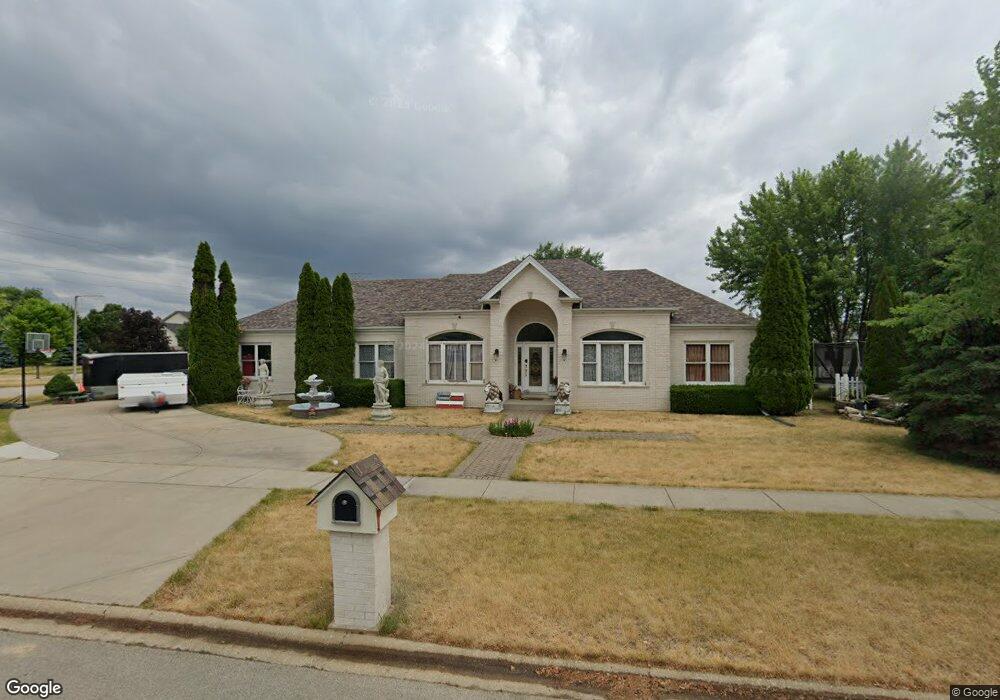
24252 Cabernet Ln Plainfield, IL 60586
East Plainfield NeighborhoodEstimated Value: $442,000 - $489,000
Studio
--
Bath
2,159
Sq Ft
$217/Sq Ft
Est. Value
About This Home
This home is located at 24252 Cabernet Ln, Plainfield, IL 60586 and is currently estimated at $469,309, approximately $217 per square foot. 24252 Cabernet Ln is a home located in Will County with nearby schools including Richard Ira Jones Middle School, Plainfield North High School, and St Mary Immaculate Parish School.
Ownership History
Date
Name
Owned For
Owner Type
Purchase Details
Closed on
Dec 10, 2002
Sold by
Designer Properties Inc
Bought by
Moreno Rafael
Current Estimated Value
Home Financials for this Owner
Home Financials are based on the most recent Mortgage that was taken out on this home.
Original Mortgage
$300,700
Interest Rate
6.25%
Purchase Details
Closed on
Jun 21, 2002
Sold by
Trotsky David J and Trotsky Maria J
Bought by
Designer Properties Inc
Home Financials for this Owner
Home Financials are based on the most recent Mortgage that was taken out on this home.
Original Mortgage
$233,250
Interest Rate
4.75%
Mortgage Type
Construction
Purchase Details
Closed on
Jul 19, 2001
Sold by
Goedken Jill
Bought by
Trotsky David J and Trotsky Maria J
Home Financials for this Owner
Home Financials are based on the most recent Mortgage that was taken out on this home.
Original Mortgage
$58,300
Interest Rate
7.22%
Create a Home Valuation Report for This Property
The Home Valuation Report is an in-depth analysis detailing your home's value as well as a comparison with similar homes in the area
Home Values in the Area
Average Home Value in this Area
Purchase History
| Date | Buyer | Sale Price | Title Company |
|---|---|---|---|
| Moreno Rafael | $334,500 | First American Title | |
| Designer Properties Inc | $72,500 | First American Title | |
| Trotsky David J | $67,000 | First American Title |
Source: Public Records
Mortgage History
| Date | Status | Borrower | Loan Amount |
|---|---|---|---|
| Closed | Moreno Rafael | $300,700 | |
| Previous Owner | Designer Properties Inc | $233,250 | |
| Previous Owner | Trotsky David J | $58,300 |
Source: Public Records
Tax History
| Year | Tax Paid | Tax Assessment Tax Assessment Total Assessment is a certain percentage of the fair market value that is determined by local assessors to be the total taxable value of land and additions on the property. | Land | Improvement |
|---|---|---|---|---|
| 2024 | $9,252 | $139,341 | $32,083 | $107,258 |
| 2023 | $9,252 | $125,850 | $28,977 | $96,873 |
| 2022 | $9,605 | $124,333 | $28,628 | $95,705 |
| 2021 | $9,072 | $116,199 | $26,755 | $89,444 |
| 2020 | $8,943 | $112,902 | $25,996 | $86,906 |
| 2019 | $8,628 | $107,577 | $24,770 | $82,807 |
| 2018 | $9,212 | $112,274 | $23,273 | $89,001 |
| 2017 | $8,929 | $106,694 | $22,116 | $84,578 |
| 2016 | $8,711 | $101,759 | $21,093 | $80,666 |
| 2015 | -- | $109,185 | $19,759 | $89,426 |
| 2014 | -- | $105,330 | $19,061 | $86,269 |
| 2013 | -- | $105,330 | $19,061 | $86,269 |
Source: Public Records
Map
Nearby Homes
- 24508 W Easy St
- 24403 Spruce Creek Ct Unit 3
- 0007 Illinois Route 59
- 0003 Illinois Route 59
- 0009 Illinois Route 59
- 0005 Illinois Route 59
- 0006 Illinois Route 59
- 16515 Driftwood Dr
- 00000 Dayfield Dr
- 0000 Dayfield Dr
- 000000 Dayfield Dr
- 0 Dayfield Dr Unit MRD11616300
- 24825 Barolo Dr
- 15707 S Route 59
- 23856 W Dayfield Dr
- 23825 W Dayfield Dr
- 23628 W Rueben St
- 23700 W Getson Ave
- 15412 S James St
- 25017 W Soldier Way
- 16125 Vintage Dr
- 24244 Cabernet Ln
- 24253 Cabernet Ln
- 16119 Vintage Dr
- 24243 Simo Dr
- 24234 Cabernet Ln
- 24245 Cabernet Ln
- 16128 Vintage Dr
- 16138 Vintage Dr
- 24233 Simo Dr
- 24235 Cabernet Ln
- 16148 Vintage Dr
- 24226 Cabernet Ln
- 24227 Cabernet Ln
- 24250 Merlot Ln
- 24225 Simo Dr
- 24250 Simo Dr
- 24250 Simo Dr
- 24242 Merlot Ln
Your Personal Tour Guide
Ask me questions while you tour the home.