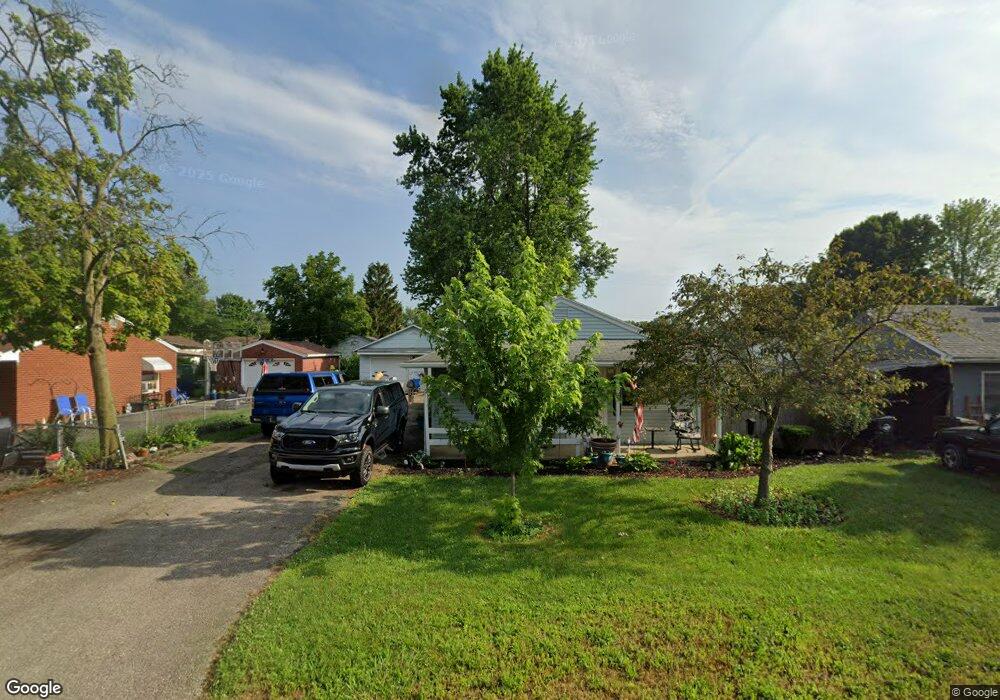
2427 Harding Ave Dayton, OH 45414
Northridge NeighborhoodEstimated Value: $98,000 - $105,000
2
Beds
1
Bath
720
Sq Ft
$141/Sq Ft
Est. Value
About This Home
This home is located at 2427 Harding Ave, Dayton, OH 45414 and is currently estimated at $101,212, approximately $140 per square foot. 2427 Harding Ave is a home located in Montgomery County with nearby schools including Northridge High School, Horizon Science Academy-Dayton Elementary School, and North Dayton School of Science & Discovery.
Ownership History
Date
Name
Owned For
Owner Type
Purchase Details
Closed on
Apr 8, 2019
Sold by
Fiedler Shane J and Puterbaugh Sheri M
Bought by
Banker Patrick
Current Estimated Value
Purchase Details
Closed on
May 10, 2007
Sold by
Hecht Tom and Hecht Connie S
Bought by
Fiedler Shane J and Puterbaugh Sheri M
Home Financials for this Owner
Home Financials are based on the most recent Mortgage that was taken out on this home.
Original Mortgage
$56,119
Interest Rate
6.27%
Mortgage Type
FHA
Purchase Details
Closed on
Jan 24, 2007
Sold by
Va
Bought by
Hecht Tom
Purchase Details
Closed on
Apr 4, 2005
Sold by
Guaranty Residential Lending
Bought by
Va
Purchase Details
Closed on
Dec 30, 2004
Sold by
Thomas James V
Bought by
Guaranty Residential Lending and Temple Inland Mortgage Corp
Purchase Details
Closed on
Feb 28, 1996
Sold by
Mills George T
Bought by
Mills George T and Thomas Tara D
Create a Home Valuation Report for This Property
The Home Valuation Report is an in-depth analysis detailing your home's value as well as a comparison with similar homes in the area
Home Values in the Area
Average Home Value in this Area
Purchase History
| Date | Buyer | Sale Price | Title Company |
|---|---|---|---|
| Banker Patrick | $43,000 | None Available | |
| Fiedler Shane J | $57,000 | Attorney | |
| Hecht Tom | -- | Titlequest Agency Inc | |
| Va | -- | None Available | |
| Guaranty Residential Lending | $40,000 | None Available | |
| Mills George T | -- | -- |
Source: Public Records
Mortgage History
| Date | Status | Borrower | Loan Amount |
|---|---|---|---|
| Previous Owner | Fiedler Shane J | $56,119 |
Source: Public Records
Tax History Compared to Growth
Tax History
| Year | Tax Paid | Tax Assessment Tax Assessment Total Assessment is a certain percentage of the fair market value that is determined by local assessors to be the total taxable value of land and additions on the property. | Land | Improvement |
|---|---|---|---|---|
| 2024 | $1,469 | $17,860 | $4,410 | $13,450 |
| 2023 | $1,469 | $17,860 | $4,410 | $13,450 |
| 2022 | $1,373 | $12,760 | $3,150 | $9,610 |
| 2021 | $1,348 | $12,760 | $3,150 | $9,610 |
| 2020 | $1,375 | $12,760 | $3,150 | $9,610 |
| 2019 | $1,215 | $9,780 | $3,150 | $6,630 |
| 2018 | $1,371 | $9,780 | $3,150 | $6,630 |
| 2017 | $1,181 | $9,780 | $3,150 | $6,630 |
| 2016 | $1,117 | $9,190 | $3,150 | $6,040 |
| 2015 | $1,086 | $9,190 | $3,150 | $6,040 |
| 2014 | $1,086 | $9,190 | $3,150 | $6,040 |
| 2012 | -- | $12,890 | $4,270 | $8,620 |
Source: Public Records
Map
Nearby Homes
- 2203 Arthur Ave
- 2100 Harding Ave
- 2024 Kildare Ave
- 6020 Volkman Dr
- 6114 Miller Ln
- 2160 Martin Ave
- 5586 Wadsworth Rd
- 2021 Gipsy Dr
- 2010 Gipsy Dr
- 2304 Homesite Dr
- 1657 Scenic Dr
- 3280 Benchwood Rd
- 3320 Benchwood Rd
- 3291 Benchwood Rd
- 2127 Marker Ave
- 5802 Sparkhill Dr
- 2625 Secretariat Ct
- 2006 High Knoll Dr
- 6027 Riva Ridge Dr
- 6057 Riva Ridge Dr
- 2429 Harding Ave
- 2423 Harding Ave
- 2433 Harding Ave
- 2318 Arthur Ave
- 2415 Harding Ave
- 2324 Arthur Ave
- 2435 Harding Ave
- 2312 Arthur Ave
- 2430 Harding Ave
- 2426 Harding Ave
- 2432 Harding Ave
- 2424 Harding Ave
- 2407 Harding Ave
- 2434 Harding Ave
- 2416 Harding Ave
- 6909 Pyramid Ave
- 2306 Arthur Ave
- 6901 Pyramid Ave
- 6913 Pyramid Ave
- 2410 Harding Ave