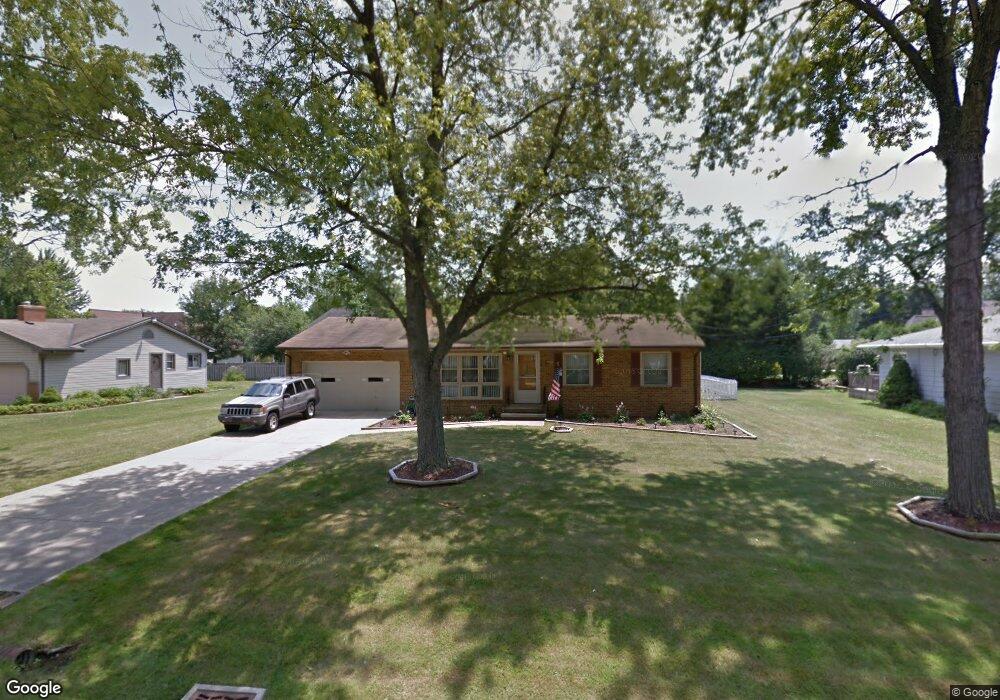
24277 Lantern Dr Olmsted Falls, OH 44138
Estimated Value: $241,698 - $338,000
3
Beds
2
Baths
1,115
Sq Ft
$246/Sq Ft
Est. Value
About This Home
This home is located at 24277 Lantern Dr, Olmsted Falls, OH 44138 and is currently estimated at $274,675, approximately $246 per square foot. 24277 Lantern Dr is a home located in Cuyahoga County with nearby schools including Falls-Lenox Primary Elementary School, Olmsted Falls Intermediate Building, and Olmsted Falls Middle School.
Ownership History
Date
Name
Owned For
Owner Type
Purchase Details
Closed on
Oct 29, 2018
Sold by
Turk Kenneth A
Bought by
Woehrman Joseph W
Current Estimated Value
Home Financials for this Owner
Home Financials are based on the most recent Mortgage that was taken out on this home.
Original Mortgage
$77,330
Outstanding Balance
$47,919
Interest Rate
4.12%
Mortgage Type
FHA
Estimated Equity
$226,756
Purchase Details
Closed on
Oct 20, 2009
Sold by
Henry Amy
Bought by
Turk Kenneth A
Home Financials for this Owner
Home Financials are based on the most recent Mortgage that was taken out on this home.
Original Mortgage
$95,200
Interest Rate
4.5%
Mortgage Type
New Conventional
Purchase Details
Closed on
Jun 18, 2005
Sold by
Batelaan Ann
Bought by
Batelaan Ann
Purchase Details
Closed on
Apr 1, 1977
Sold by
Batelaan Peter S and Batelaan Ann
Bought by
Batelaan Ann
Purchase Details
Closed on
Jan 1, 1975
Bought by
Batelaan Peter S and Batelaan Ann
Create a Home Valuation Report for This Property
The Home Valuation Report is an in-depth analysis detailing your home's value as well as a comparison with similar homes in the area
Home Values in the Area
Average Home Value in this Area
Purchase History
| Date | Buyer | Sale Price | Title Company |
|---|---|---|---|
| Woehrman Joseph W | $90,000 | Quick Sllva Title Llc | |
| Turk Kenneth A | $119,900 | Attorney | |
| Batelaan Ann | -- | Attorney | |
| Batelaan Ann | -- | -- | |
| Batelaan Peter S | -- | -- |
Source: Public Records
Mortgage History
| Date | Status | Borrower | Loan Amount |
|---|---|---|---|
| Open | Woehrman Joseph W | $77,330 | |
| Previous Owner | Turk Kenneth A | $95,200 |
Source: Public Records
Tax History Compared to Growth
Tax History
| Year | Tax Paid | Tax Assessment Tax Assessment Total Assessment is a certain percentage of the fair market value that is determined by local assessors to be the total taxable value of land and additions on the property. | Land | Improvement |
|---|---|---|---|---|
| 2024 | $5,060 | $77,140 | $9,170 | $67,970 |
| 2023 | $4,332 | $50,760 | $13,620 | $37,140 |
| 2022 | $4,296 | $50,750 | $13,615 | $37,135 |
| 2021 | $4,256 | $50,750 | $13,620 | $37,140 |
| 2020 | $4,201 | $44,520 | $11,940 | $32,590 |
| 2019 | $3,600 | $121,200 | $34,100 | $87,100 |
| 2018 | $1,799 | $42,420 | $11,940 | $30,490 |
| 2017 | $3,791 | $41,620 | $7,840 | $33,780 |
| 2016 | $3,772 | $41,620 | $7,840 | $33,780 |
| 2015 | $4,028 | $41,620 | $7,840 | $33,780 |
| 2014 | $4,028 | $41,620 | $7,840 | $33,780 |
Source: Public Records
Map
Nearby Homes
- 9855 Dupont Dr
- 24628 Sprague Rd
- 23514 Grist Mill Ct Unit 4
- V/L Aldridge Dr
- 23390 Wainwright Terrace
- 9797 Sugarbush Cir
- 549 Wyleswood Dr
- 8809 Leatherleaf Dr
- 543 Wyleswood Dr
- 9190 Waterfall Dr
- 9180 Waterfall Dr
- 23155 Wainwright Terrace
- 537 Wyleswood Dr
- 9430 Columbia Rd
- Caroline Plan at Falls Landing - Villas
- Wexford Plan at Falls Landing - Villas
- Rosecliff Plan at Falls Landing - Villas
- 23002 Chandlers Ln
- 23002 Chandlers Ln Unit 342
- 23002 Chandlers Ln Unit 221
- 24313 Lantern Dr
- 24253 Lantern Dr
- 24300 Briar Patch Dr
- 24270 Briar Patch Dr
- 24328 Lantern Dr
- 24268 Lantern Dr
- 9567 Lindbergh Blvd
- 24215 Lantern Dr
- 24240 Briar Patch Dr
- 9555 Lindbergh Blvd
- 24332 Lantern Dr
- 24254 Lantern Dr
- 24330 Briar Patch Dr
- 24210 Briar Patch Dr
- 24207 Lantern Dr
- 24275 Briar Patch Dr
- 9441 Lindbergh Blvd
- 24238 Lantern Dr
- 24251 Briar Patch Dr
- 24251 Briarpatch Dr