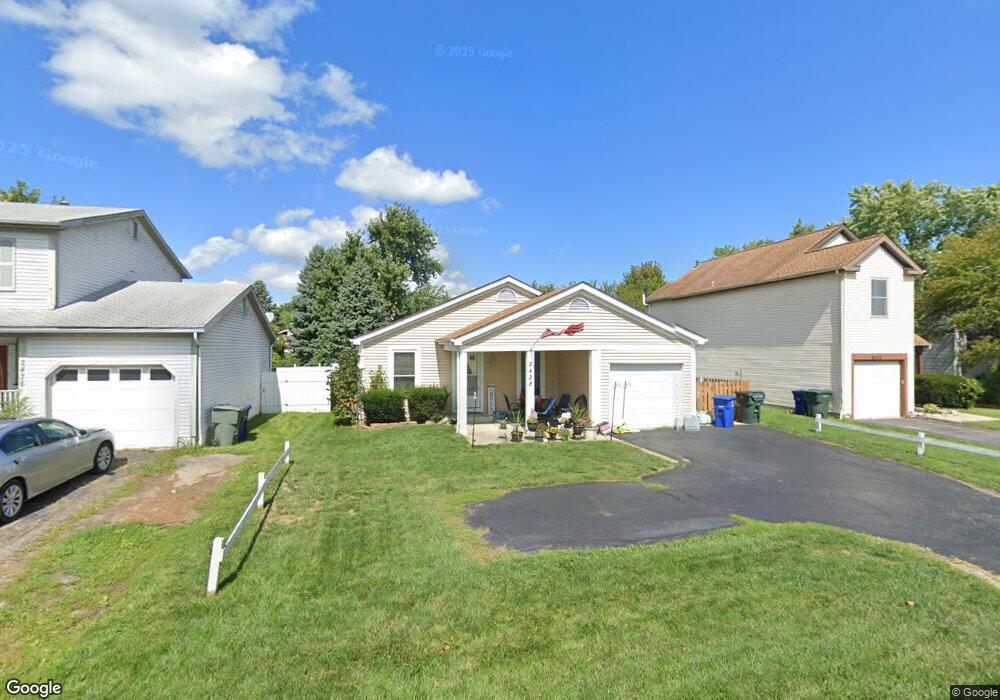
2428 Billingsley Rd Columbus, OH 43235
Foxboro NeighborhoodEstimated Value: $240,000 - $291,000
2
Beds
1
Bath
1,041
Sq Ft
$259/Sq Ft
Est. Value
About This Home
This home is located at 2428 Billingsley Rd, Columbus, OH 43235 and is currently estimated at $269,301, approximately $258 per square foot. 2428 Billingsley Rd is a home located in Franklin County with nearby schools including Albert Chapman Elementary School, Ann Simpson Davis Middle School, and Dublin Scioto High School.
Ownership History
Date
Name
Owned For
Owner Type
Purchase Details
Closed on
Jun 19, 2020
Sold by
Smith Kenneth H and Smith Emily L
Bought by
Smith Kenneth H and Smith Emily L
Current Estimated Value
Purchase Details
Closed on
May 25, 2010
Sold by
Smith Kenneth H and Smith Emily L
Bought by
Smith Emily L and Smith Kenneth H
Purchase Details
Closed on
Jan 27, 1999
Sold by
Clay Donald Wayne and Clay Sheri Jean
Bought by
Smith Kenneth H
Home Financials for this Owner
Home Financials are based on the most recent Mortgage that was taken out on this home.
Original Mortgage
$66,400
Outstanding Balance
$15,730
Interest Rate
6.75%
Estimated Equity
$253,571
Purchase Details
Closed on
May 31, 1991
Bought by
Clay Donald W and Clay Sheri J
Purchase Details
Closed on
Oct 1, 1985
Purchase Details
Closed on
Oct 1, 1984
Create a Home Valuation Report for This Property
The Home Valuation Report is an in-depth analysis detailing your home's value as well as a comparison with similar homes in the area
Home Values in the Area
Average Home Value in this Area
Purchase History
| Date | Buyer | Sale Price | Title Company |
|---|---|---|---|
| Smith Kenneth H | -- | None Available | |
| Smith Emily L | -- | Warranty Ti | |
| Smith Kenneth H | $83,000 | -- | |
| Clay Donald W | $57,900 | -- | |
| -- | $58,800 | -- | |
| -- | -- | -- |
Source: Public Records
Mortgage History
| Date | Status | Borrower | Loan Amount |
|---|---|---|---|
| Open | Smith Kenneth H | $66,400 |
Source: Public Records
Tax History Compared to Growth
Tax History
| Year | Tax Paid | Tax Assessment Tax Assessment Total Assessment is a certain percentage of the fair market value that is determined by local assessors to be the total taxable value of land and additions on the property. | Land | Improvement |
|---|---|---|---|---|
| 2024 | $4,642 | $75,180 | $31,430 | $43,750 |
| 2023 | $4,577 | $75,180 | $31,430 | $43,750 |
| 2022 | $3,290 | $50,060 | $14,460 | $35,600 |
| 2021 | $3,343 | $50,060 | $14,460 | $35,600 |
| 2020 | $3,323 | $50,060 | $14,460 | $35,600 |
| 2019 | $3,053 | $40,710 | $12,040 | $28,670 |
| 2018 | $3,093 | $40,710 | $12,040 | $28,670 |
| 2017 | $2,964 | $40,710 | $12,040 | $28,670 |
| 2016 | $3,098 | $41,860 | $11,620 | $30,240 |
| 2015 | $3,118 | $41,860 | $11,620 | $30,240 |
| 2014 | $3,121 | $41,860 | $11,620 | $30,240 |
| 2013 | $1,584 | $41,860 | $11,620 | $30,240 |
Source: Public Records
Map
Nearby Homes
- 2392 Dunsworth Dr
- 2456 Sanford Dr
- 2469 Sandstrom Dr
- 2488 Dunstan Dr
- 2220 Surreygate Dr
- 7373 Palmleaf Ln
- 7871 Thornfield Ln
- 2161 Heatherfield Ave
- 2423 Sutter Pkwy
- 7917 Meadowhaven Blvd Unit 11
- 7385 Cimmaron Station
- 2620 Cedar Lake Dr Unit 2620
- 2001 Sawbury Blvd Unit 2001
- 2074 Hard Rd
- 3915 Inverness Cir Unit 3915
- 1930 Shallowford Ave
- 6921 Spruce Pine Dr
- 1889 Slaton Ct Unit 1889
- 2475 Slateshire Dr
- 2548 Timberside Dr Unit 2548
- 2422 Billingsley Rd
- 2436 Billingsley Rd
- 2416 Billingsley Rd
- 2444 Billingsley Rd
- 2425 Dunsworth Dr
- 2417 Dunsworth Dr
- 2433 Dunsworth Dr
- 2408 Billingsley Rd
- 2452 Billingsley Rd
- 2409 Dunsworth Dr
- 2441 Dunsworth Dr
- 2449 Dunsworth Dr
- 2401 Dunsworth Dr
- 2458 Billingsley Rd
- 2400 Billingsley Rd
- 2457 Dunsworth Dr
- 2387 Dunsworth Dr
- 2464 Billingsley Rd
- 2463 Dunsworth Dr
- 2428 Dunsworth Dr