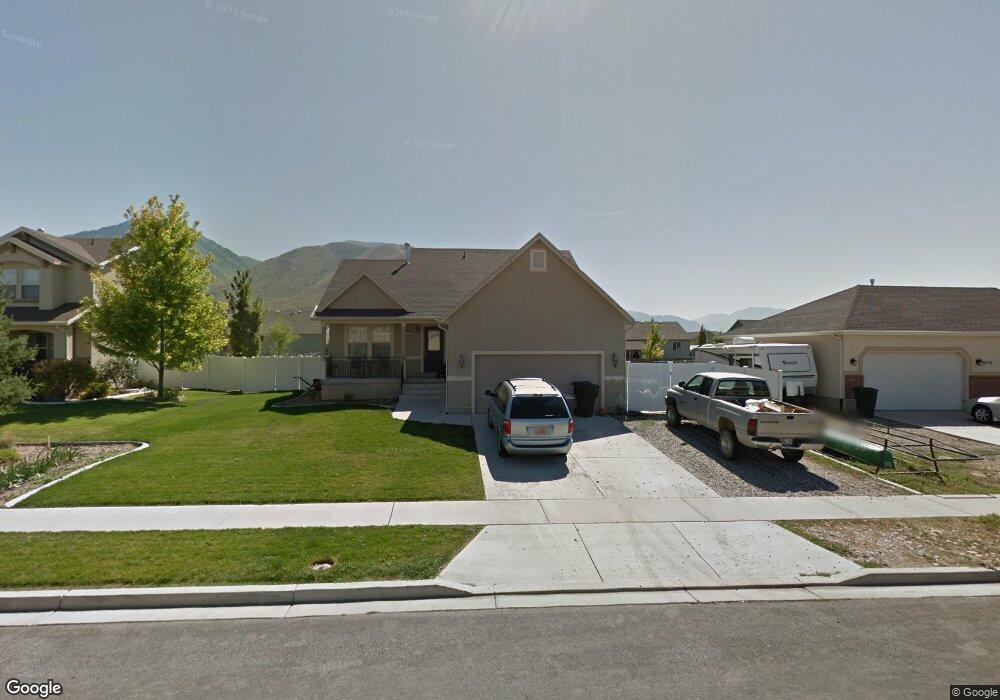
2428 E 1610 S Spanish Fork, UT 84660
Estimated Value: $533,616 - $608,000
5
Beds
3
Baths
2,360
Sq Ft
$241/Sq Ft
Est. Value
About This Home
This home is located at 2428 E 1610 S, Spanish Fork, UT 84660 and is currently estimated at $567,654, approximately $240 per square foot. 2428 E 1610 S is a home located in Utah County with nearby schools including Spanish Oaks Elementary School, Mapleton Junior High School, and Maple Mountain High School.
Ownership History
Date
Name
Owned For
Owner Type
Purchase Details
Closed on
Dec 10, 2009
Sold by
Gygi Michael Brian and Gygi Stacy M
Bought by
Jones Matthew D and Jones Amber Kimberly
Current Estimated Value
Home Financials for this Owner
Home Financials are based on the most recent Mortgage that was taken out on this home.
Original Mortgage
$185,773
Outstanding Balance
$121,047
Interest Rate
4.88%
Mortgage Type
FHA
Estimated Equity
$446,607
Purchase Details
Closed on
Aug 30, 2006
Sold by
Gates Barry A
Bought by
Gygi Michael Brian and Gygi Stacy M
Home Financials for this Owner
Home Financials are based on the most recent Mortgage that was taken out on this home.
Original Mortgage
$220,500
Interest Rate
8.65%
Mortgage Type
Balloon
Purchase Details
Closed on
Sep 15, 2004
Sold by
Custom Home Group Lc
Bought by
Gates Barry A
Create a Home Valuation Report for This Property
The Home Valuation Report is an in-depth analysis detailing your home's value as well as a comparison with similar homes in the area
Home Values in the Area
Average Home Value in this Area
Purchase History
| Date | Buyer | Sale Price | Title Company |
|---|---|---|---|
| Jones Matthew D | -- | Eagle Pointe Title Insurance | |
| Gygi Michael Brian | -- | Inwest Title Services Sal | |
| Gates Barry A | -- | Backman Stewart Title Servi | |
| Custom Home Group Lc | -- | Backman Stewart Title Servi |
Source: Public Records
Mortgage History
| Date | Status | Borrower | Loan Amount |
|---|---|---|---|
| Open | Jones Matthew D | $185,773 | |
| Previous Owner | Gygi Michael Brian | $220,500 |
Source: Public Records
Tax History
| Year | Tax Paid | Tax Assessment Tax Assessment Total Assessment is a certain percentage of the fair market value that is determined by local assessors to be the total taxable value of land and additions on the property. | Land | Improvement |
|---|---|---|---|---|
| 2025 | $2,428 | $265,815 | -- | -- |
| 2024 | $2,428 | $250,250 | $0 | $0 |
| 2023 | $2,493 | $257,290 | $0 | $0 |
| 2022 | $2,490 | $251,955 | $0 | $0 |
| 2021 | $2,052 | $332,300 | $117,200 | $215,100 |
| 2020 | $1,942 | $305,700 | $106,500 | $199,200 |
| 2019 | $1,760 | $291,500 | $92,300 | $199,200 |
| 2018 | $1,686 | $269,900 | $88,800 | $181,100 |
| 2017 | $1,611 | $138,655 | $0 | $0 |
| 2016 | $1,494 | $126,885 | $0 | $0 |
| 2015 | $1,358 | $113,905 | $0 | $0 |
| 2014 | $1,285 | $108,185 | $0 | $0 |
Source: Public Records
Map
Nearby Homes
- 2662 E 1600 S
- 2397 E 1370 S
- 1817 S 2510 E
- 1949 S 2410 E
- 2710 E Canyon Rd
- 804 E 1610 S Unit 91
- 824 E 1610 S Unit 92
- 1282 S 2000 E
- 1357 S 2950 E
- 1061 S 2230 E
- 2972 E Canyon Meadows Dr Unit 335
- 2984 E Canyon Meadows Dr
- 3013 E Canyon Meadows Dr Unit 314
- 1627 S 3050 E
- 2744 E 1060 S
- 1062 S 2740 E
- 1058 S 2740 E
- 2968 E Canyon Meadows Dr
- 1072 S 2760 E
- 1056 S 2740 E
- 2416 E 1610 S
- 2416 E 1610 S Unit 24
- 2442 E 1610 S
- 2429 E 1650 S
- 2413 E 1650 S
- 2437 E 1650 S
- 2394 E 1610 S
- 2394 E 1610 S Unit 25
- 1052 S 2450 E Unit 911
- 2433 E 1610 S
- 2419 E 1610 S
- 2419 E 1610 S Unit 23
- 2399 E 1650 S
- 2447 E 1610 S
- 2397 E 1610 S Unit 22
- 1623 S 2450 E
- 2376 E 1610 S Unit 26
- 2459 E 1610 S
- 2489 E 1650 S
- 2387 E 1650 S
Your Personal Tour Guide
Ask me questions while you tour the home.