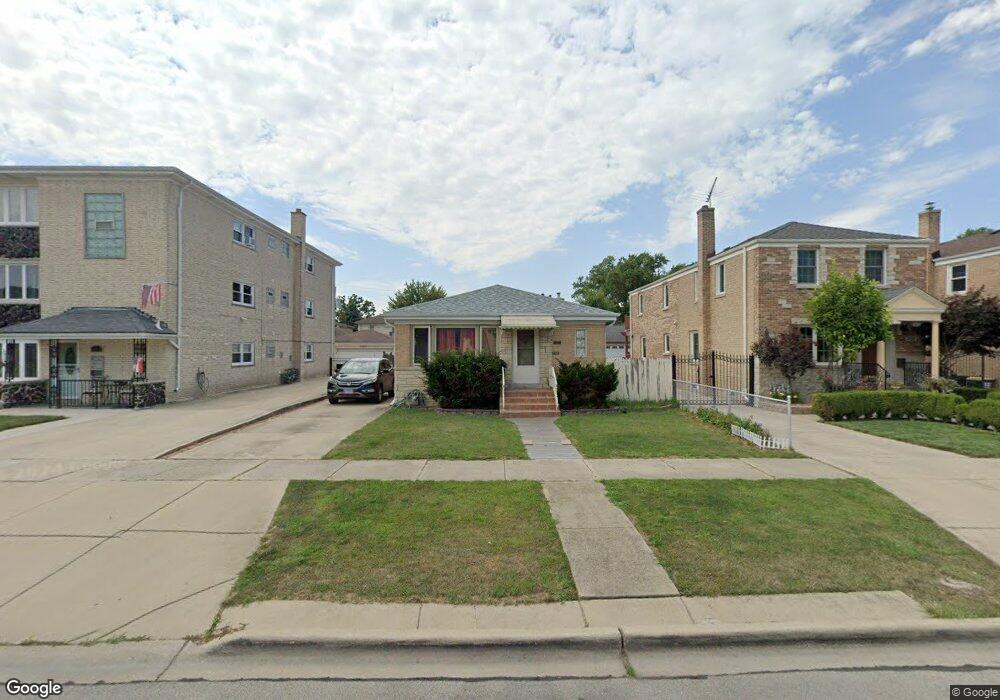
2428 N 78th Ct Elmwood Park, IL 60707
Estimated Value: $321,100 - $340,000
2
Beds
1
Bath
1,008
Sq Ft
$328/Sq Ft
Est. Value
About This Home
This home is located at 2428 N 78th Ct, Elmwood Park, IL 60707 and is currently estimated at $330,775, approximately $328 per square foot. 2428 N 78th Ct is a home located in Cook County with nearby schools including Elmwood Elementary School, John Mills Elementary School, and Elm Middle School.
Ownership History
Date
Name
Owned For
Owner Type
Purchase Details
Closed on
May 2, 2025
Sold by
Salerno Andrea
Bought by
Parkway Bank And Trust and Trust Number 17159
Current Estimated Value
Purchase Details
Closed on
Mar 11, 2004
Sold by
Fiore John and Fiore Caroline
Bought by
Salerno Andrea
Home Financials for this Owner
Home Financials are based on the most recent Mortgage that was taken out on this home.
Original Mortgage
$199,200
Interest Rate
4.37%
Mortgage Type
Unknown
Purchase Details
Closed on
Nov 10, 2003
Sold by
Karowski Helen
Bought by
Fiore John and Fiore Caroline
Home Financials for this Owner
Home Financials are based on the most recent Mortgage that was taken out on this home.
Original Mortgage
$160,200
Interest Rate
6.07%
Mortgage Type
Unknown
Create a Home Valuation Report for This Property
The Home Valuation Report is an in-depth analysis detailing your home's value as well as a comparison with similar homes in the area
Home Values in the Area
Average Home Value in this Area
Purchase History
| Date | Buyer | Sale Price | Title Company |
|---|---|---|---|
| Parkway Bank And Trust | -- | None Listed On Document | |
| Salerno Andrea | $249,000 | Multiple | |
| Fiore John | $178,000 | Atg |
Source: Public Records
Mortgage History
| Date | Status | Borrower | Loan Amount |
|---|---|---|---|
| Previous Owner | Salerno Andrea | $199,200 | |
| Previous Owner | Fiore John | $160,200 |
Source: Public Records
Tax History Compared to Growth
Tax History
| Year | Tax Paid | Tax Assessment Tax Assessment Total Assessment is a certain percentage of the fair market value that is determined by local assessors to be the total taxable value of land and additions on the property. | Land | Improvement |
|---|---|---|---|---|
| 2024 | $2,505 | $26,000 | $7,541 | $18,459 |
| 2023 | $2,709 | $26,000 | $7,541 | $18,459 |
| 2022 | $2,709 | $26,000 | $7,541 | $18,459 |
| 2021 | $3,250 | $22,685 | $5,027 | $17,658 |
| 2020 | $2,925 | $22,685 | $5,027 | $17,658 |
| 2019 | $2,598 | $25,404 | $5,027 | $20,377 |
| 2018 | $4,430 | $21,203 | $4,329 | $16,874 |
| 2017 | $2,747 | $21,203 | $4,329 | $16,874 |
| 2016 | $3,225 | $21,203 | $4,329 | $16,874 |
| 2015 | $3,606 | $16,853 | $3,910 | $12,943 |
| 2014 | $4,102 | $16,853 | $3,910 | $12,943 |
| 2013 | $4,045 | $18,551 | $3,910 | $14,641 |
Source: Public Records
Map
Nearby Homes
- 2523 N East Brook Rd
- 7650 W Altgeld St Unit 306
- 2626 N 78th Ave
- 7718 W Westwood Dr
- 2525 Davisson St
- 7917 W Westwood Dr
- 7611 W Altgeld St Unit 2N
- 7807 W Cressett Dr
- 7871 W Oakleaf Ave
- 2521 N 76th Ave Unit 2SW
- 2541 N 76th Ave
- 7722 W Sunset Dr
- 2711 N 77th Ave
- 7851 W Cressett Dr
- 2100 N 77th Ct
- 2224 N 75th Ct
- 8211 W Grand Ave
- 2501 Budd St
- 2143 N 76th Ave
- 7428 W Fullerton Ave
- 2430 N 78th Ct
- 2426 N 78th Ct
- 2432 N 78th Ct
- 2420 N 78th Ct
- 2434 N 78th Ct
- 2425 N 79th Ave
- 2418 N 78th Ct
- 2436 N 78th Ct
- 2435 N 79th Ave
- 2419 N 79th Ave
- 2439 N 79th Ave
- 2410 N 78th Ct
- 2440 N 78th Ct
- 2440 N 78th Ct Unit 1
- 2440 N 78th Ct Unit GARDEN
- 2440 N 78th Ct Unit 2
- 2441 N 79th Ave
- 2431 N 78th Ct
- 2431 N 78th Ct Unit 1W
- 2431 N 78th Ct Unit GW