
2428 S C St Elwood, IN 46036
Estimated payment $784/month
Highlights
- Mature Trees
- No HOA
- Eat-In Kitchen
- Corner Lot
- 1 Car Detached Garage
- Laundry Room
About This Home
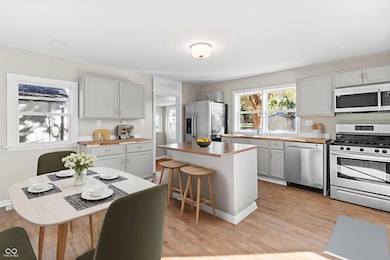
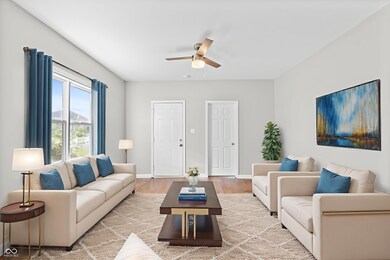
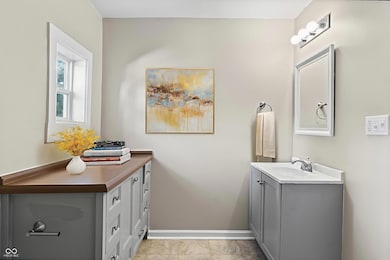
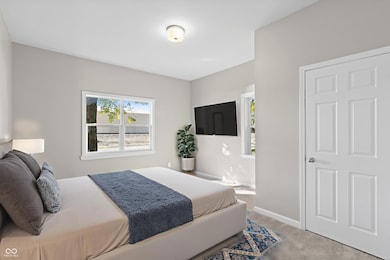
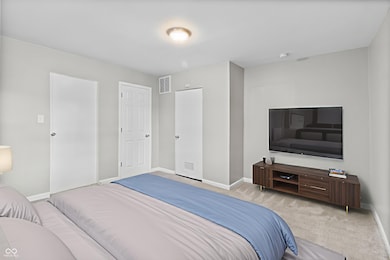
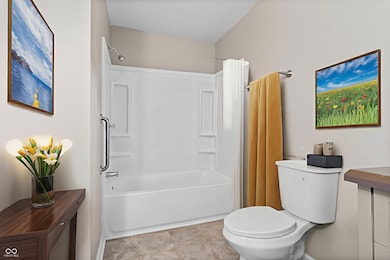
Fully Remodeled Home on an Oversized Corner Lot! Welcome to this beautifully remodeled 2-bedroom home that feels far larger than expected, thanks to its open-concept layout connecting the kitchen, dining, and living spaces. Every corner of this home has been thoughtfully updated to provide both style and comfort. Step into the spacious kitchen, featuring tons of cabinets and countertop space, plus a center island with an overhang-perfect for pulling up a few stools for quick meals or casual conversation. The kitchen flows seamlessly into the living and dining areas, making it ideal for entertaining or family gatherings. The extra-large bathroom includes a dual vanity setup-one side perfect for use as a convenient changing station or additional counter space. Just off the hallway, a flexible open storage area offers the perfect spot for a large pantry or additional shelving-ideal for food storage or organization. Enjoy peaceful mornings in the fully enclosed front porch, lined wall-to-wall with windows for natural light and a relaxing atmosphere. Outside, the extra-large corner lot provides abundant yard space, while the 1-car garage offers secure parking or workshop potential. And one of the biggest highlights-a long-lasting metal roof known for its exceptional durability and low maintenance-gives peace of mind for decades to come. If you're looking for a move-in ready home with space, updates, and lasting quality, this one checks all the boxes!
Home Details
Home Type
- Single Family
Est. Annual Taxes
- $1,828
Year Built
- Built in 1900 | Remodeled
Lot Details
- 4,876 Sq Ft Lot
- Corner Lot
- Mature Trees
Parking
- 1 Car Detached Garage
Home Design
- Bungalow
- Wood Siding
Interior Spaces
- 1,007 Sq Ft Home
- 1-Story Property
- Paddle Fans
- Combination Kitchen and Dining Room
- Crawl Space
- Attic Access Panel
- Fire and Smoke Detector
Kitchen
- Eat-In Kitchen
- Gas Oven
- Microwave
- Dishwasher
- Disposal
Flooring
- Carpet
- Vinyl Plank
Bedrooms and Bathrooms
- 2 Bedrooms
- 1 Full Bathroom
Laundry
- Laundry Room
- Laundry on main level
- Washer and Dryer Hookup
Utilities
- Forced Air Heating and Cooling System
- Electric Water Heater
Community Details
- No Home Owners Association
Listing and Financial Details
- Assessor Parcel Number 480415102139000027
Map
Home Values in the Area
Average Home Value in this Area
Tax History
| Year | Tax Paid | Tax Assessment Tax Assessment Total Assessment is a certain percentage of the fair market value that is determined by local assessors to be the total taxable value of land and additions on the property. | Land | Improvement |
|---|---|---|---|---|
| 2024 | $1,828 | $91,400 | $8,600 | $82,800 |
| 2023 | $1,688 | $84,400 | $8,200 | $76,200 |
| 2022 | $1,748 | $86,900 | $7,700 | $79,200 |
| 2021 | $1,626 | $81,300 | $7,700 | $73,600 |
| 2020 | $610 | $29,900 | $7,300 | $22,600 |
| 2019 | $10 | $32,100 | $7,300 | $24,800 |
| 2018 | $10 | $30,500 | $7,300 | $23,200 |
| 2017 | $0 | $30,300 | $7,300 | $23,000 |
| 2016 | $10 | $28,900 | $7,300 | $21,600 |
| 2014 | -- | $28,400 | $7,300 | $21,100 |
| 2013 | -- | $28,400 | $7,300 | $21,100 |
Property History
| Date | Event | Price | List to Sale | Price per Sq Ft |
|---|---|---|---|---|
| 11/01/2025 11/01/25 | Pending | -- | -- | -- |
| 11/01/2025 11/01/25 | For Sale | $119,900 | 0.0% | $119 / Sq Ft |
| 10/24/2025 10/24/25 | Pending | -- | -- | -- |
| 10/21/2025 10/21/25 | For Sale | $119,900 | -- | $119 / Sq Ft |
Purchase History
| Date | Type | Sale Price | Title Company |
|---|---|---|---|
| Warranty Deed | -- | None Available | |
| Warranty Deed | -- | None Available | |
| Quit Claim Deed | -- | None Available | |
| Interfamily Deed Transfer | -- | -- |
Source: MIBOR Broker Listing Cooperative®
MLS Number: 22069314
APN: 48-04-15-102-139.000-027
Disclaimer: Certain information contained herein is derived from information provided by parties other than Homes.com. All information provided is deemed reliable, but is not guaranteed to be accurate and should be independently verified.
![]() Based on information submitted to the MLS GRID. All data is obtained from various sources and may not have been verified by broker or MLS GRID. Supplied Open House Information is subject to change without notice. All information should be independently reviewed and verified for accuracy. Properties may or may not be listed by the office/agent presenting the information. Some IDX listings have been excluded from this website.
Based on information submitted to the MLS GRID. All data is obtained from various sources and may not have been verified by broker or MLS GRID. Supplied Open House Information is subject to change without notice. All information should be independently reviewed and verified for accuracy. Properties may or may not be listed by the office/agent presenting the information. Some IDX listings have been excluded from this website.
