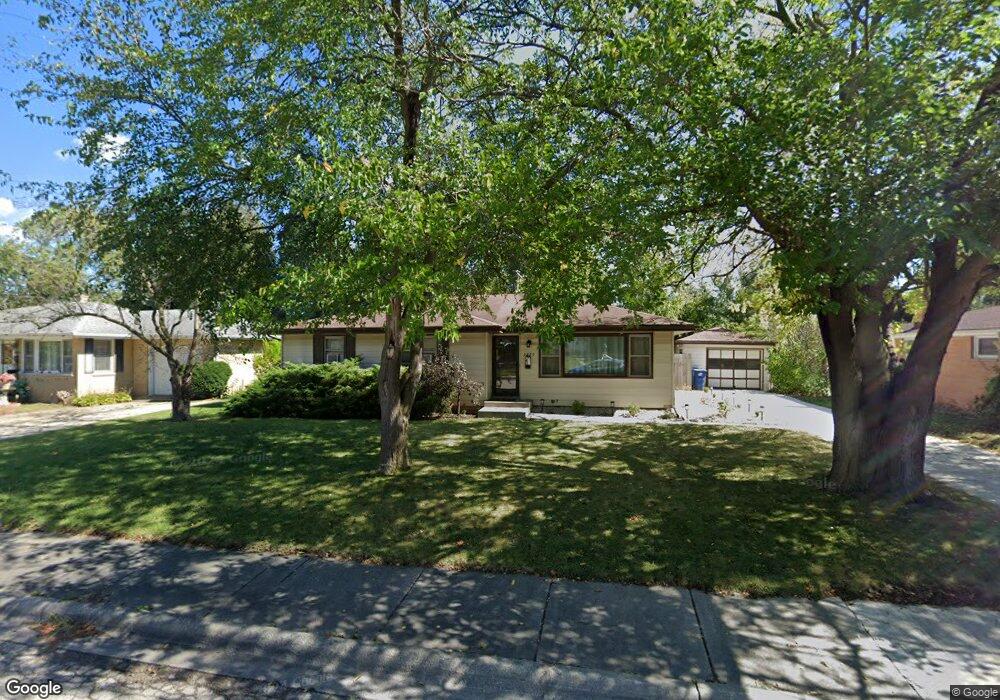
2429 Dunlay Ct Waukegan, IL 60085
West Waukegan NeighborhoodEstimated Value: $244,834 - $299,000
3
Beds
2
Baths
1,417
Sq Ft
$186/Sq Ft
Est. Value
About This Home
This home is located at 2429 Dunlay Ct, Waukegan, IL 60085 and is currently estimated at $263,709, approximately $186 per square foot. 2429 Dunlay Ct is a home located in Lake County with nearby schools including Whittier Elementary School, Robert E. Abbott Middle School, and Waukegan High School.
Ownership History
Date
Name
Owned For
Owner Type
Purchase Details
Closed on
Jan 12, 2013
Sold by
Valdez Jennifer L
Bought by
Rivera Alberto
Current Estimated Value
Home Financials for this Owner
Home Financials are based on the most recent Mortgage that was taken out on this home.
Original Mortgage
$151,304
Outstanding Balance
$105,839
Interest Rate
3.5%
Mortgage Type
FHA
Estimated Equity
$157,870
Purchase Details
Closed on
Jun 26, 2008
Sold by
Kaether Brett Parr and Kaether Mary Kathleen
Bought by
Rivera Alberto and Valdez Jennifer L
Home Financials for this Owner
Home Financials are based on the most recent Mortgage that was taken out on this home.
Original Mortgage
$159,743
Interest Rate
5.96%
Mortgage Type
FHA
Purchase Details
Closed on
Jan 20, 1998
Sold by
Paas Eira and Schwartz Elsa I
Bought by
Kaether Brett Parr and Kaether Mary Kathleen
Home Financials for this Owner
Home Financials are based on the most recent Mortgage that was taken out on this home.
Original Mortgage
$106,000
Interest Rate
7.24%
Create a Home Valuation Report for This Property
The Home Valuation Report is an in-depth analysis detailing your home's value as well as a comparison with similar homes in the area
Home Values in the Area
Average Home Value in this Area
Purchase History
| Date | Buyer | Sale Price | Title Company |
|---|---|---|---|
| Rivera Alberto | -- | None Available | |
| Rivera Alberto | $162,000 | Ticor | |
| Kaether Brett Parr | $111,500 | Chicago Title Insurance Co |
Source: Public Records
Mortgage History
| Date | Status | Borrower | Loan Amount |
|---|---|---|---|
| Open | Rivera Alberto | $151,304 | |
| Previous Owner | Rivera Alberto | $159,743 | |
| Previous Owner | Kaether Brett Parr | $106,000 |
Source: Public Records
Tax History Compared to Growth
Tax History
| Year | Tax Paid | Tax Assessment Tax Assessment Total Assessment is a certain percentage of the fair market value that is determined by local assessors to be the total taxable value of land and additions on the property. | Land | Improvement |
|---|---|---|---|---|
| 2024 | $4,179 | $58,965 | $12,550 | $46,415 |
| 2023 | $4,843 | $52,316 | $11,135 | $41,181 |
| 2022 | $4,843 | $55,540 | $11,480 | $44,060 |
| 2021 | $4,613 | $50,245 | $10,801 | $39,444 |
| 2020 | $4,626 | $46,809 | $10,062 | $36,747 |
| 2019 | $4,603 | $42,893 | $9,220 | $33,673 |
| 2018 | $4,597 | $41,936 | $11,188 | $30,748 |
| 2017 | $4,424 | $37,101 | $9,898 | $27,203 |
| 2016 | $4,055 | $32,239 | $8,601 | $23,638 |
| 2015 | $3,861 | $28,854 | $7,698 | $21,156 |
| 2014 | $3,768 | $27,806 | $7,930 | $19,876 |
| 2012 | $4,889 | $30,126 | $8,592 | $21,534 |
Source: Public Records
Map
Nearby Homes
- 0 Brookside Ave
- 24 Washington Terrace
- 2115 Lydia St
- 102 Baldwin Ave
- 49 S Lewis Ave
- 615 Tiffany Dr
- 132 Dorchester Ct
- 1213 Grand Ave
- 12601 W Atlantic Ave
- 2116 & 2101 Williamsburg Dr
- 2726 W Hidden Glen Dr
- 1521 Catalpa Ave
- 1416 Hamilton Ct
- 3170 W Monroe St Unit 309
- 621 N Austin Ave
- 34887 N Austin Ave
- 603 N Austin Ave
- 23 N Jackson St
- 1005 N Lewis Ave
- 824 N Butrick St
- 2431 Dunlay Ct
- 2425 Dunlay Ct
- 110 N Sumac Ave
- 112 N Sumac Ave
- 104 N Sumac Ave
- 2421 Dunlay Ct
- 2412 Dunlay Ct
- 2435 Dunlay Ct
- 120 N Sumac Ave
- 100 N Sumac Ave
- 2408 Dunlay Ct
- 2416 Dunlay Ct
- 50 N Sumac Ave
- 122 N Sumac Ave
- 2420 Dunlay Ct
- 2404 Dunlay Ct
- 2415 Dunlay Ct
- 2439 Dunlay Ct
- 46 N Sumac Ave
- 128 N Sumac Ave