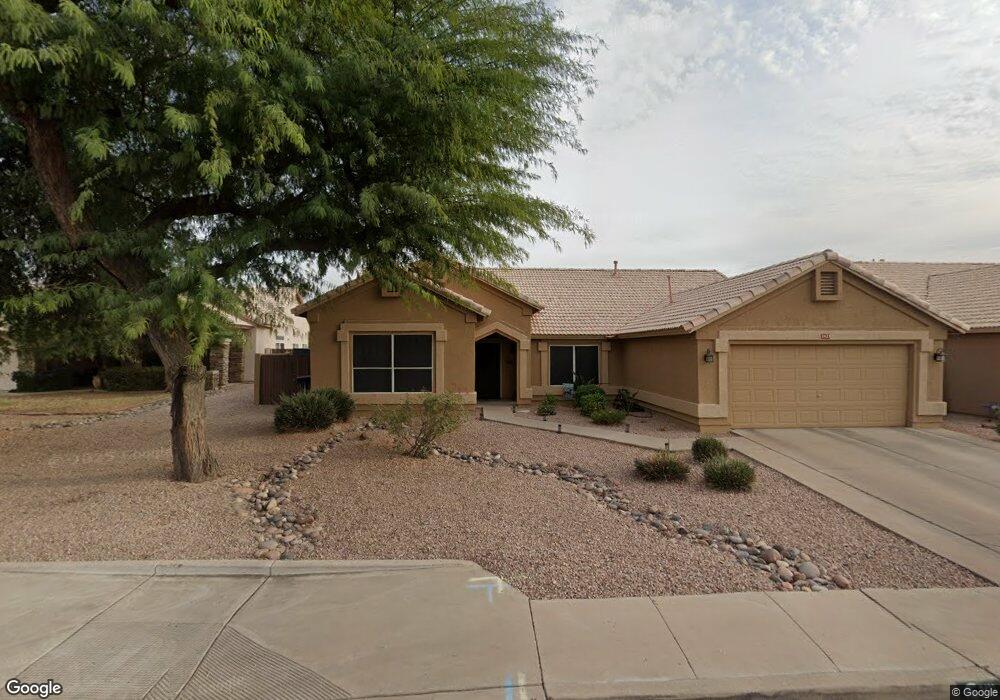
2429 S Brighton Cir Mesa, AZ 85209
Superstition Springs NeighborhoodEstimated Value: $485,155 - $567,000
4
Beds
2
Baths
2,214
Sq Ft
$243/Sq Ft
Est. Value
About This Home
This home is located at 2429 S Brighton Cir, Mesa, AZ 85209 and is currently estimated at $539,039, approximately $243 per square foot. 2429 S Brighton Cir is a home located in Maricopa County with nearby schools including Superstition Springs Elementary School, Highland Jr High School, and Highland High School.
Ownership History
Date
Name
Owned For
Owner Type
Purchase Details
Closed on
Jun 22, 2006
Sold by
Lansberry Mark W and Lansberry Candace J
Bought by
Hoerrmann Mark
Current Estimated Value
Home Financials for this Owner
Home Financials are based on the most recent Mortgage that was taken out on this home.
Original Mortgage
$183,000
Outstanding Balance
$108,130
Interest Rate
6.66%
Mortgage Type
New Conventional
Estimated Equity
$430,909
Purchase Details
Closed on
Dec 20, 2000
Sold by
Roberts Dolores J and Roberts Delores J
Bought by
Lansberry Mark W and Lansberry Candace J
Home Financials for this Owner
Home Financials are based on the most recent Mortgage that was taken out on this home.
Original Mortgage
$148,240
Interest Rate
7.65%
Mortgage Type
VA
Purchase Details
Closed on
May 17, 1994
Sold by
Roberts Ralph H
Bought by
Roberts Dolores J
Create a Home Valuation Report for This Property
The Home Valuation Report is an in-depth analysis detailing your home's value as well as a comparison with similar homes in the area
Home Values in the Area
Average Home Value in this Area
Purchase History
| Date | Buyer | Sale Price | Title Company |
|---|---|---|---|
| Hoerrmann Mark | $305,000 | Chicago Title Insurance Co | |
| Lansberry Mark W | $153,775 | First American Title | |
| Roberts Dolores J | -- | United Title Agency | |
| Roberts Dolores J | $128,683 | United Title Agency |
Source: Public Records
Mortgage History
| Date | Status | Borrower | Loan Amount |
|---|---|---|---|
| Open | Hoerrmann Mark | $183,000 | |
| Previous Owner | Lansberry Mark W | $148,240 |
Source: Public Records
Tax History Compared to Growth
Tax History
| Year | Tax Paid | Tax Assessment Tax Assessment Total Assessment is a certain percentage of the fair market value that is determined by local assessors to be the total taxable value of land and additions on the property. | Land | Improvement |
|---|---|---|---|---|
| 2025 | $1,990 | $26,866 | -- | -- |
| 2024 | $1,931 | $25,587 | -- | -- |
| 2023 | $1,931 | $40,950 | $8,190 | $32,760 |
| 2022 | $1,884 | $32,460 | $6,490 | $25,970 |
| 2021 | $2,040 | $30,560 | $6,110 | $24,450 |
| 2020 | $2,005 | $28,480 | $5,690 | $22,790 |
| 2019 | $1,858 | $26,080 | $5,210 | $20,870 |
| 2018 | $1,769 | $24,610 | $4,920 | $19,690 |
| 2017 | $1,713 | $23,130 | $4,620 | $18,510 |
| 2016 | $1,768 | $22,300 | $4,460 | $17,840 |
| 2015 | $1,629 | $21,350 | $4,270 | $17,080 |
Source: Public Records
Map
Nearby Homes
- 7137 E Laguna Azul Ave
- 2414 S Revolta
- 6956 E Milagro Ave
- 2617 S Athena
- 7452 E Milagro Ave
- 7265 E Lindner Ave
- 7247 E Kiva Ave
- 7349 E Keats Ave
- 7101 E Baseline Rd
- 7525 E Kilarea Ave
- 7428 E Osage Ave
- 7362 E Onza Ave
- 7234 E Plata Ave
- 7149 E Plata Ave
- 7229 E Plata Ave
- 1102 N Blackbird Dr
- 7511 E Osage Ave
- 7755 E Laguna Azul Ave Unit 147
- 7755 E Laguna Azul Ave Unit 184
- 7437 E Onza Ave
- 2435 S Brighton
- 2423 S Brighton Cir
- 2441 S Brighton
- 7154 E Milagro Ave
- 7146 E Milagro Ave
- 2417 S Brighton Cir
- 7162 E Milagro Ave
- 7138 E Milagro Ave
- 7129 E Madero Ave
- 2447 S Brighton
- 2426 S Brighton Cir
- 2411 S Brighton Cir Unit 1
- 7130 E Milagro Ave
- 7126 E Meseto Ave
- 2412 S Brighton Cir
- 2420 S Brighton Cir
- 7125 E Madero Ave
- 2545 W Monte Ave
- 7143 E Milagro Ave
- 7122 E Meseto Ave