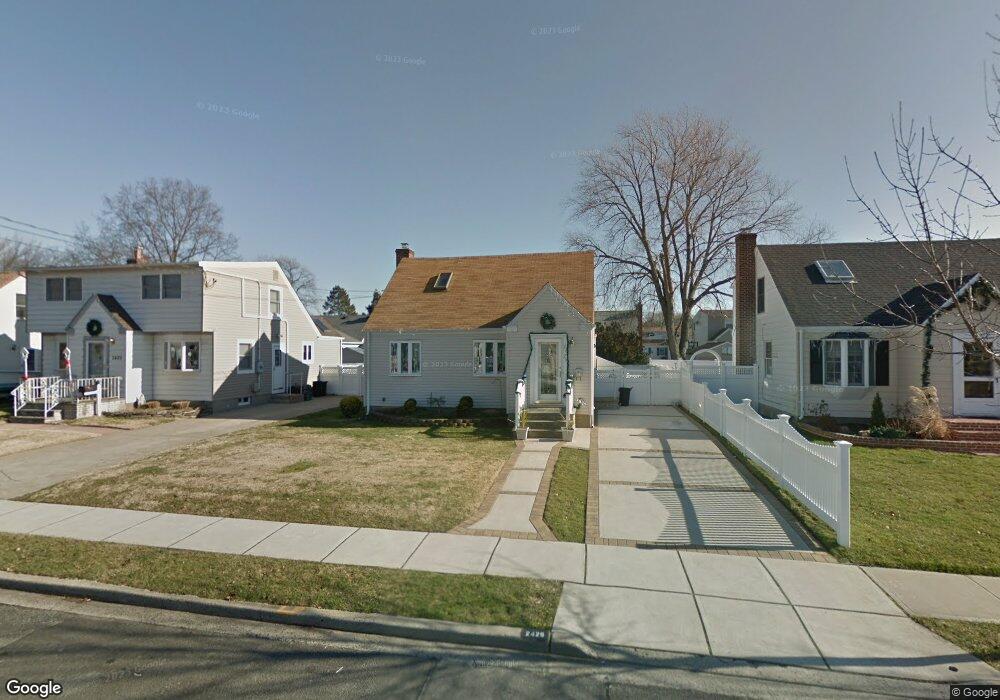
2429 Sycamore Ave Wantagh, NY 11793
Estimated Value: $633,069 - $647,000
--
Bed
2
Baths
1,322
Sq Ft
$484/Sq Ft
Est. Value
About This Home
This home is located at 2429 Sycamore Ave, Wantagh, NY 11793 and is currently estimated at $640,035, approximately $484 per square foot. 2429 Sycamore Ave is a home located in Nassau County with nearby schools including Wantagh Middle School, Wantagh Senior High School, and Maplewood School.
Ownership History
Date
Name
Owned For
Owner Type
Purchase Details
Closed on
Aug 25, 2015
Sold by
Vidaic Jennifer
Bought by
Tetro Vincent and Tetro Jaimi
Current Estimated Value
Home Financials for this Owner
Home Financials are based on the most recent Mortgage that was taken out on this home.
Original Mortgage
$348,000
Outstanding Balance
$273,514
Interest Rate
4.01%
Mortgage Type
Purchase Money Mortgage
Estimated Equity
$366,521
Purchase Details
Closed on
Sep 4, 2014
Sold by
Skinner Francis Jerome
Bought by
Kurtay Nancy M
Purchase Details
Closed on
Sep 27, 1999
Sold by
Demarco Sophie and Sheridan Patricia
Bought by
Skinner Francis Jerome and Skinner Catherine
Home Financials for this Owner
Home Financials are based on the most recent Mortgage that was taken out on this home.
Original Mortgage
$50,000
Interest Rate
7.44%
Mortgage Type
Purchase Money Mortgage
Purchase Details
Closed on
Sep 1, 1998
Create a Home Valuation Report for This Property
The Home Valuation Report is an in-depth analysis detailing your home's value as well as a comparison with similar homes in the area
Home Values in the Area
Average Home Value in this Area
Purchase History
| Date | Buyer | Sale Price | Title Company |
|---|---|---|---|
| Tetro Vincent | $448,000 | Commonwealth Land Title | |
| Kurtay Nancy M | -- | Attorney | |
| Skinner Francis Jerome | $220,000 | -- | |
| -- | -- | -- |
Source: Public Records
Mortgage History
| Date | Status | Borrower | Loan Amount |
|---|---|---|---|
| Open | Tetro Vincent | $348,000 | |
| Previous Owner | Skinner Francis Jerome | $50,000 | |
| Previous Owner | Skinner Francis Jerome | $75,000 |
Source: Public Records
Tax History Compared to Growth
Tax History
| Year | Tax Paid | Tax Assessment Tax Assessment Total Assessment is a certain percentage of the fair market value that is determined by local assessors to be the total taxable value of land and additions on the property. | Land | Improvement |
|---|---|---|---|---|
| 2025 | $7,713 | $403 | $167 | $236 |
| 2024 | $2,629 | $418 | $173 | $245 |
| 2023 | $6,489 | $433 | $179 | $254 |
| 2022 | $6,489 | $433 | $179 | $254 |
| 2021 | $7,359 | $431 | $177 | $254 |
| 2020 | $4,749 | $511 | $510 | $1 |
| 2019 | $5,538 | $548 | $547 | $1 |
| 2018 | $5,613 | $584 | $0 | $0 |
| 2017 | $3,497 | $621 | $510 | $111 |
| 2016 | $6,049 | $658 | $540 | $118 |
| 2015 | -- | $820 | $673 | $147 |
| 2014 | -- | $820 | $673 | $147 |
| 2013 | $2,773 | $820 | $673 | $147 |
Source: Public Records
Map
Nearby Homes
- 2395 Mermaid Ave
- 2500 Mermaid Ave
- 2436 Hempstead Ln
- 3208 Linden St
- 2333 Beech St
- 2536 Riverside Dr
- 2775 Barbara Rd
- 2675 Bellmore Ave
- 2347 Pine St
- 2198 Willow St
- 2335 Maple St
- 2711 W Alder Rd
- 906 Ardmore Place
- 2217 Fir St
- 2777 Len Dr
- 2679 W Alder Rd
- 8 Trezza Ct
- 3268 Jackson Ave
- 402 Marle Place
- 111 1st Place
- 2425 Sycamore Ave
- 2435 Sycamore Ave
- 2419 Sycamore Ave
- 2439 Sycamore Ave
- 2432 Woodland Ave
- 2426 Woodland Ave
- 2436 Woodland Ave
- 2422 Woodland Ave
- 2430 Sycamore Ave
- 2426 Sycamore Ave
- 2415 Sycamore Ave
- 2445 Sycamore Ave
- 2420 Sycamore Ave
- 2440 Sycamore Ave
- 2416 Woodland Ave
- 2446 Woodland Ave
- 2449 Sycamore Ave
- 2416 Sycamore Ave
- 2411 Sycamore Ave
- 2446 Sycamore Ave