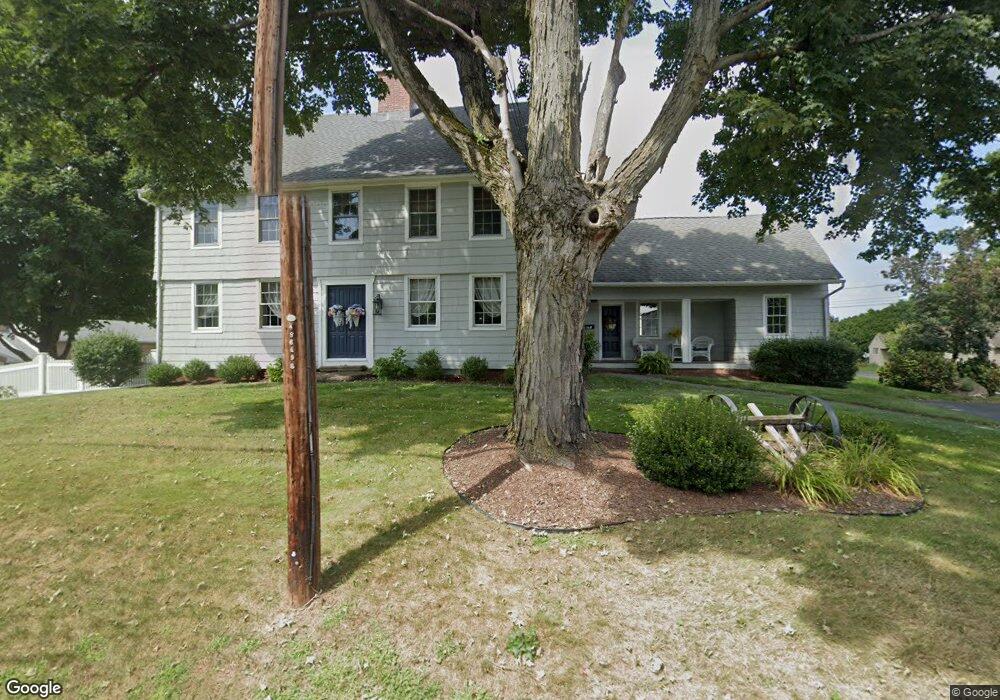
243 Alling St Berlin, CT 06037
Estimated Value: $439,000 - $518,256
3
Beds
3
Baths
3,172
Sq Ft
$155/Sq Ft
Est. Value
About This Home
This home is located at 243 Alling St, Berlin, CT 06037 and is currently estimated at $491,314, approximately $154 per square foot. 243 Alling St is a home located in Hartford County with nearby schools including Mary E. Griswold School, Catherine M. Mcgee Middle School, and Berlin High School.
Ownership History
Date
Name
Owned For
Owner Type
Purchase Details
Closed on
Aug 27, 2004
Sold by
Vernacatola Mary
Bought by
Richards Jeffrey L and Richards Mary Q
Current Estimated Value
Purchase Details
Closed on
Jul 14, 2004
Sold by
Vernacatola Mary
Bought by
Pn Dipinto Bldrs Llc
Purchase Details
Closed on
Aug 20, 2001
Sold by
Pechout Shirley E and Soneson Elaine D
Bought by
Vernacatola Mary
Create a Home Valuation Report for This Property
The Home Valuation Report is an in-depth analysis detailing your home's value as well as a comparison with similar homes in the area
Home Values in the Area
Average Home Value in this Area
Purchase History
| Date | Buyer | Sale Price | Title Company |
|---|---|---|---|
| Richards Jeffrey L | $257,500 | -- | |
| Richards Jeffrey L | $257,500 | -- | |
| Pn Dipinto Bldrs Llc | $100,000 | -- | |
| Pn Dipinto Bldrs Llc | $100,000 | -- | |
| Vernacatola Mary | $125,000 | -- | |
| Vernacatola Mary | $125,000 | -- |
Source: Public Records
Mortgage History
| Date | Status | Borrower | Loan Amount |
|---|---|---|---|
| Open | Vernacatola Mary | $204,664 | |
| Closed | Vernacatola Mary | $215,000 | |
| Closed | Vernacatola Mary | $200,010 |
Source: Public Records
Tax History
| Year | Tax Paid | Tax Assessment Tax Assessment Total Assessment is a certain percentage of the fair market value that is determined by local assessors to be the total taxable value of land and additions on the property. | Land | Improvement |
|---|---|---|---|---|
| 2025 | $7,472 | $243,800 | $87,600 | $156,200 |
| 2024 | $7,365 | $243,800 | $87,600 | $156,200 |
| 2023 | $7,207 | $243,800 | $87,600 | $156,200 |
| 2022 | $6,773 | $197,400 | $78,100 | $119,300 |
| 2021 | $6,698 | $197,400 | $78,100 | $119,300 |
| 2020 | $6,698 | $197,400 | $78,100 | $119,300 |
| 2019 | $6,698 | $197,400 | $78,100 | $119,300 |
| 2018 | $6,416 | $197,400 | $78,100 | $119,300 |
| 2017 | $6,464 | $204,500 | $77,400 | $127,100 |
| 2016 | $6,301 | $204,500 | $77,400 | $127,100 |
| 2015 | $6,207 | $204,500 | $77,400 | $127,100 |
| 2014 | $5,914 | $204,500 | $77,400 | $127,100 |
Source: Public Records
Map
Nearby Homes
Your Personal Tour Guide
Ask me questions while you tour the home.