Estimated Value: $361,175 - $381,000
3
Beds
2
Baths
1,278
Sq Ft
$294/Sq Ft
Est. Value
About This Home
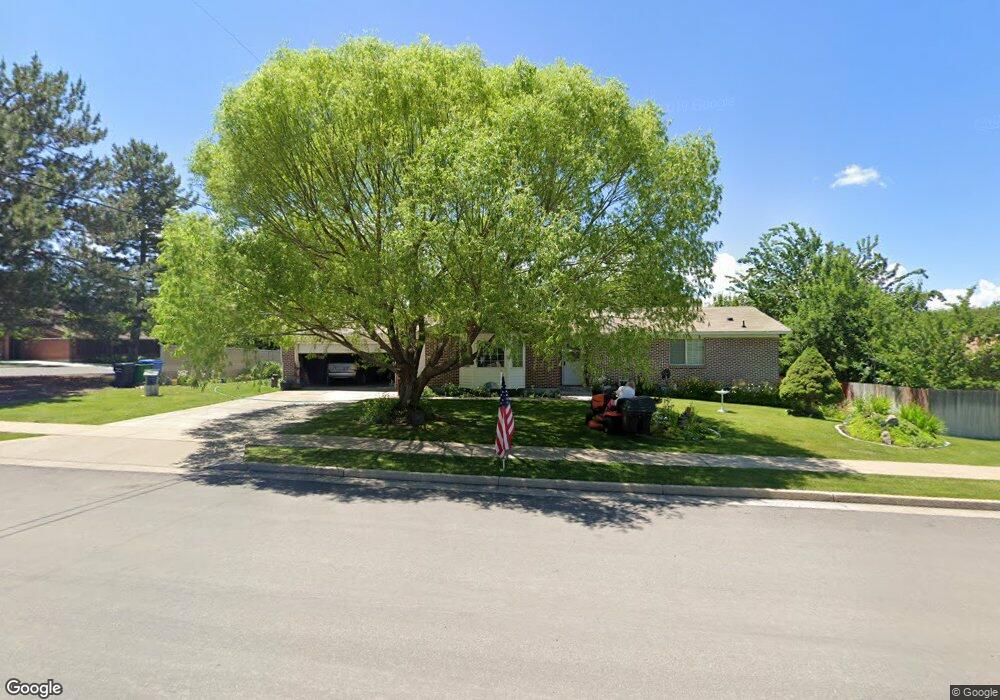
This home is located at 243 Apple Dr, Hyrum, UT 84319 and is currently estimated at $375,294, approximately $293 per square foot. 243 Apple Dr is a home located in Cache County with nearby schools including Millville School, South Cache Middle School, and Mountain Crest High School.
Ownership History
Date
Name
Owned For
Owner Type
Purchase Details
Closed on
Apr 11, 2022
Sold by
Luann Hone
Bought by
Luann Hone Trust
Current Estimated Value
Home Financials for this Owner
Home Financials are based on the most recent Mortgage that was taken out on this home.
Original Mortgage
$45,000
Outstanding Balance
$35,650
Interest Rate
3.14%
Mortgage Type
New Conventional
Estimated Equity
$339,644
Purchase Details
Closed on
Jun 11, 2009
Sold by
Teters Leonard Ray
Bought by
Hone Luann
Home Financials for this Owner
Home Financials are based on the most recent Mortgage that was taken out on this home.
Original Mortgage
$40,000
Interest Rate
4.76%
Mortgage Type
New Conventional
Purchase Details
Closed on
Feb 24, 2009
Sold by
Cruz Jose N
Bought by
Deutsche Bank National Trust Company
Purchase Details
Closed on
Nov 11, 2005
Sold by
Juniper Services Inc
Bought by
Cruz Jose N
Home Financials for this Owner
Home Financials are based on the most recent Mortgage that was taken out on this home.
Original Mortgage
$23,900
Interest Rate
5.97%
Mortgage Type
Stand Alone Second
Purchase Details
Closed on
Aug 9, 2005
Sold by
Austin Loren J A
Bought by
Juniper Services Inc
Create a Home Valuation Report for This Property
The Home Valuation Report is an in-depth analysis detailing your home's value as well as a comparison with similar homes in the area
Home Values in the Area
Average Home Value in this Area
Purchase History
| Date | Buyer | Sale Price | Title Company |
|---|---|---|---|
| Luann Hone Trust | -- | Us Title | |
| Hone Luann | -- | Advanced Title | |
| Deutsche Bank National Trust Company | $111,694 | None Available | |
| Cruz Jose N | -- | American Secure Title | |
| Juniper Services Inc | $99,450 | None Available |
Source: Public Records
Mortgage History
| Date | Status | Borrower | Loan Amount |
|---|---|---|---|
| Open | Luann Hone Trust | $45,000 | |
| Previous Owner | Hone Luann | $40,000 | |
| Previous Owner | Cruz Jose N | $23,900 | |
| Previous Owner | Cruz Jose N | $95,600 |
Source: Public Records
Tax History
| Year | Tax Paid | Tax Assessment Tax Assessment Total Assessment is a certain percentage of the fair market value that is determined by local assessors to be the total taxable value of land and additions on the property. | Land | Improvement |
|---|---|---|---|---|
| 2025 | $1,203 | $172,680 | $0 | $0 |
| 2024 | $1,282 | $171,890 | $0 | $0 |
| 2023 | $1,135 | $145,505 | $0 | $0 |
| 2022 | $1,184 | $145,505 | $0 | $0 |
| 2021 | $1,187 | $224,650 | $65,050 | $159,600 |
| 2020 | $1,048 | $186,110 | $65,050 | $121,060 |
| 2019 | $952 | $159,060 | $38,000 | $121,060 |
| 2018 | $887 | $143,270 | $38,000 | $105,270 |
| 2017 | $877 | $73,535 | $0 | $0 |
| 2016 | $897 | $73,535 | $0 | $0 |
| 2015 | $836 | $68,355 | $0 | $0 |
| 2014 | $804 | $67,255 | $0 | $0 |
| 2013 | $798 | $69,455 | $0 | $0 |
Source: Public Records
Map
Nearby Homes
- 730 Anderson Ave
- 720 Anderson Ave
- 260 Apple Dr
- 280 Apple Dr
- 710 Anderson Ave
- 240 Apple Dr
- 721 Anderson Ave
- 725 Anderson Ave
- 747 Anderson Ave
- 700 Anderson Ave
- 751 Anderson Ave
- 616 Anderson Ave
- 180 Apple Dr
- 255 Scenic View Dr Unit 42
- 270 Scenic View Dr
- 776 Anderson Ave
- 765 Anderson Ave
- 740 Sunrise Ave
- 210 Park Ave
- 220 Park Ave
Your Personal Tour Guide
Ask me questions while you tour the home.