Estimated Value: $415,000 - $453,000
3
Beds
4
Baths
2,355
Sq Ft
$186/Sq Ft
Est. Value
About This Home
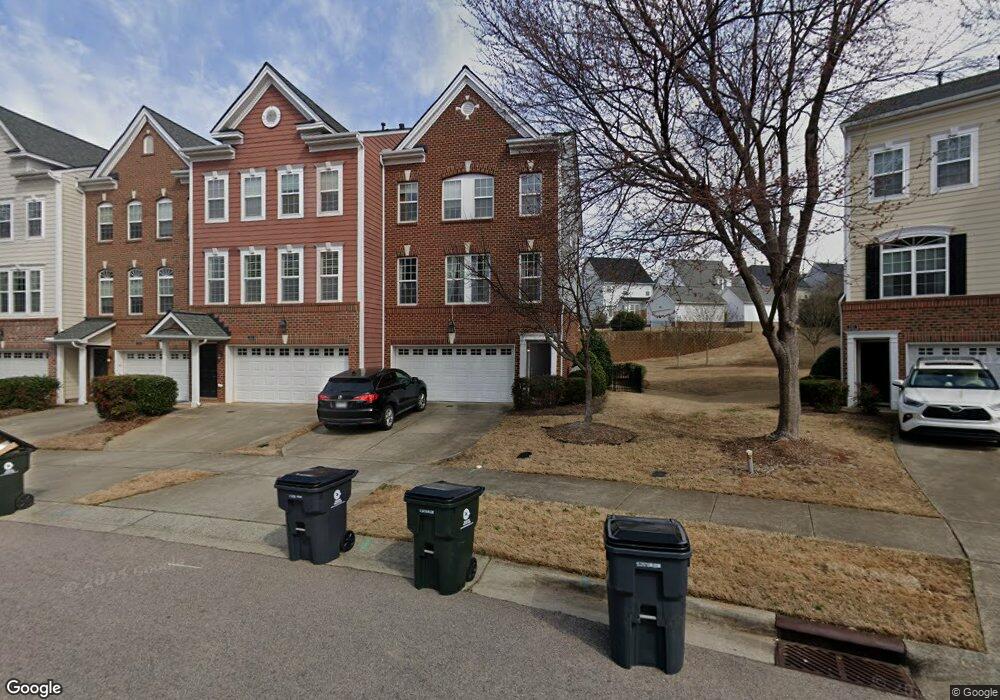
This home is located at 243 Bally Shannon Way, Apex, NC 27539 and is currently estimated at $437,542, approximately $185 per square foot. 243 Bally Shannon Way is a home located in Wake County with nearby schools including Middle Creek Elementary School, Dillard Drive Magnet Middle School, and Apex High School.
Ownership History
Date
Name
Owned For
Owner Type
Purchase Details
Closed on
Aug 27, 2018
Sold by
Tyo Jarrett A and Tyo Kate
Bought by
Cooney Daniel James
Current Estimated Value
Home Financials for this Owner
Home Financials are based on the most recent Mortgage that was taken out on this home.
Original Mortgage
$192,675
Outstanding Balance
$167,678
Interest Rate
4.5%
Mortgage Type
New Conventional
Estimated Equity
$269,864
Purchase Details
Closed on
Sep 29, 2015
Sold by
Wood Dominic F and Wood Candice J
Bought by
Tyo Jarrett A
Home Financials for this Owner
Home Financials are based on the most recent Mortgage that was taken out on this home.
Original Mortgage
$205,200
Interest Rate
3.94%
Mortgage Type
VA
Purchase Details
Closed on
Jun 6, 2007
Sold by
Lennar Carolinas Llc
Bought by
Wood Dominic F and Wood Candice J
Home Financials for this Owner
Home Financials are based on the most recent Mortgage that was taken out on this home.
Original Mortgage
$210,190
Interest Rate
6.12%
Mortgage Type
Unknown
Create a Home Valuation Report for This Property
The Home Valuation Report is an in-depth analysis detailing your home's value as well as a comparison with similar homes in the area
Home Values in the Area
Average Home Value in this Area
Purchase History
| Date | Buyer | Sale Price | Title Company |
|---|---|---|---|
| Cooney Daniel James | $257,000 | None Available | |
| Tyo Jarrett A | $228,000 | Attorney | |
| Wood Dominic F | $210,500 | None Available |
Source: Public Records
Mortgage History
| Date | Status | Borrower | Loan Amount |
|---|---|---|---|
| Open | Cooney Daniel James | $192,675 | |
| Previous Owner | Tyo Jarrett A | $205,200 | |
| Previous Owner | Wood Dominic F | $210,190 |
Source: Public Records
Tax History Compared to Growth
Tax History
| Year | Tax Paid | Tax Assessment Tax Assessment Total Assessment is a certain percentage of the fair market value that is determined by local assessors to be the total taxable value of land and additions on the property. | Land | Improvement |
|---|---|---|---|---|
| 2025 | $3,579 | $413,567 | $90,000 | $323,567 |
| 2024 | $3,564 | $413,567 | $90,000 | $323,567 |
| 2023 | $2,616 | $240,638 | $35,000 | $205,638 |
| 2022 | $2,525 | $240,638 | $35,000 | $205,638 |
| 2021 | $2,478 | $240,638 | $35,000 | $205,638 |
| 2020 | $2,478 | $240,638 | $35,000 | $205,638 |
| 2019 | $2,625 | $216,537 | $45,000 | $171,537 |
| 2018 | $0 | $216,537 | $45,000 | $171,537 |
| 2017 | $2,288 | $216,537 | $45,000 | $171,537 |
| 2016 | $2,279 | $218,701 | $45,000 | $173,701 |
| 2015 | -- | $214,897 | $42,000 | $172,897 |
| 2014 | -- | $214,897 | $42,000 | $172,897 |
Source: Public Records
Map
Nearby Homes
- 104 Highland Mist Cir
- 208 Bellagio Dr
- 4724 Sunset Lake Rd
- 4721 Edwards Dr
- 9640 Holly Springs Rd
- 5033 Sunset Lake Rd
- 107 Ransomwood Dr
- 103 Pleasant Glen Ln
- 157 Writing Rock Place
- 155 Writing Rock Place
- 115 Bowerbank Ln
- 4425 Surry Ridge Cir
- 200 Seagraves Creek Ln
- 116 Seagraves Creek Ln
- 201 Mayfield Dr
- 209 Mayfield Dr
- 127 Willow View Ln
- 109 Willow View Ln
- 212 Mystic Pine Place
- 104 Ironcreek Place
- 241 Bally Shannon Way
- 239 Bally Shannon Way
- 245 Bally Shannon Way
- 247 Bally Shannon Way
- 237 Bally Shannon Way
- 249 Bally Shannon Way
- 251 Bally Shannon Way
- 252 Bally Shannon Way
- 233 Bally Shannon Way
- 125 Bally Shannon Way
- 254 Bally Shannon Way
- 121 Bally Shannon Way
- 256 Bally Shannon Way
- 129 Bally Shannon Way
- 258 Bally Shannon Way
- 117 Bally Shannon Way
- 253 Bally Shannon Way
- 133 Bally Shannon Way
- 229 Bally Shannon Way
- 255 Bally Shannon Way