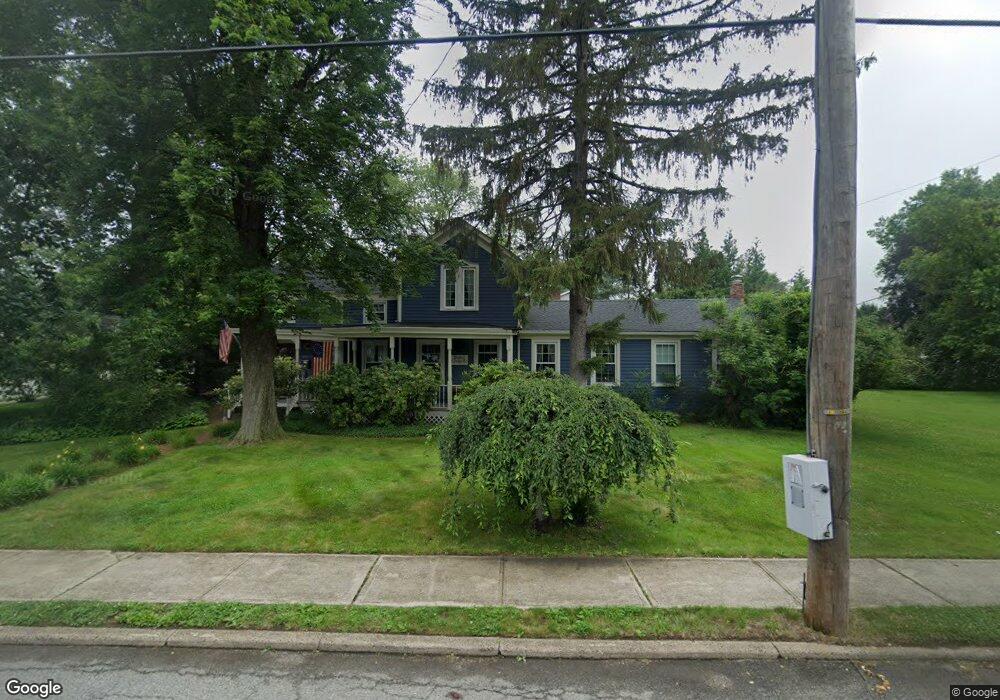
243 Boulevard Pompton Plains, NJ 07444
Estimated Value: $919,149 - $1,008,000
--
Bed
--
Bath
3,355
Sq Ft
$291/Sq Ft
Est. Value
About This Home
This home is located at 243 Boulevard, Pompton Plains, NJ 07444 and is currently estimated at $975,787, approximately $290 per square foot. 243 Boulevard is a home located in Morris County with nearby schools including Pequannock Twp High School, Netherlands Reformed Christian School, and Chancellor Academy.
Ownership History
Date
Name
Owned For
Owner Type
Purchase Details
Closed on
Oct 22, 2003
Sold by
Kirby Cynthia
Bought by
Silva John and Silva Michele
Current Estimated Value
Home Financials for this Owner
Home Financials are based on the most recent Mortgage that was taken out on this home.
Original Mortgage
$398,000
Outstanding Balance
$180,618
Interest Rate
5.81%
Estimated Equity
$795,169
Create a Home Valuation Report for This Property
The Home Valuation Report is an in-depth analysis detailing your home's value as well as a comparison with similar homes in the area
Home Values in the Area
Average Home Value in this Area
Purchase History
| Date | Buyer | Sale Price | Title Company |
|---|---|---|---|
| Silva John | $498,000 | -- |
Source: Public Records
Mortgage History
| Date | Status | Borrower | Loan Amount |
|---|---|---|---|
| Open | Silva John | $398,000 |
Source: Public Records
Tax History Compared to Growth
Tax History
| Year | Tax Paid | Tax Assessment Tax Assessment Total Assessment is a certain percentage of the fair market value that is determined by local assessors to be the total taxable value of land and additions on the property. | Land | Improvement |
|---|---|---|---|---|
| 2025 | $13,801 | $754,700 | $336,500 | $418,200 |
| 2024 | $12,318 | $756,200 | $314,000 | $442,200 |
| 2023 | $12,318 | $670,200 | $269,000 | $401,200 |
| 2022 | $11,599 | $464,500 | $253,800 | $210,700 |
| 2021 | $11,599 | $464,500 | $253,800 | $210,700 |
| 2020 | $11,450 | $464,500 | $253,800 | $210,700 |
| 2019 | $11,078 | $464,500 | $253,800 | $210,700 |
| 2018 | $10,660 | $464,500 | $253,800 | $210,700 |
| 2017 | $10,317 | $464,500 | $253,800 | $210,700 |
| 2016 | $9,991 | $464,500 | $253,800 | $210,700 |
| 2015 | $9,945 | $464,500 | $253,800 | $210,700 |
| 2014 | $9,708 | $464,500 | $253,800 | $210,700 |
Source: Public Records
Map
Nearby Homes
- 14 Evelyn Place
- 520 Newark Pompton Turnpike Unit C316
- 48 Caroline Ave
- 26 Voorhis Place
- 26 Brookside Ave
- 108 Boulevard
- 107 Chatfield Dr
- 17 Garden Place
- 120 Greenwood Ave
- 35 Mountain Ave
- 2 Carol Place
- 5314 Tudor Dr
- 7 1st St
- 5105 Tudor Dr Unit 5105
- 48 Mandeville Ave
- 43 Madison St
- 1 Lenape Ct
- 111 Deerfield Rd
- 38 Marlin Ave
- 342 Sunset Rd