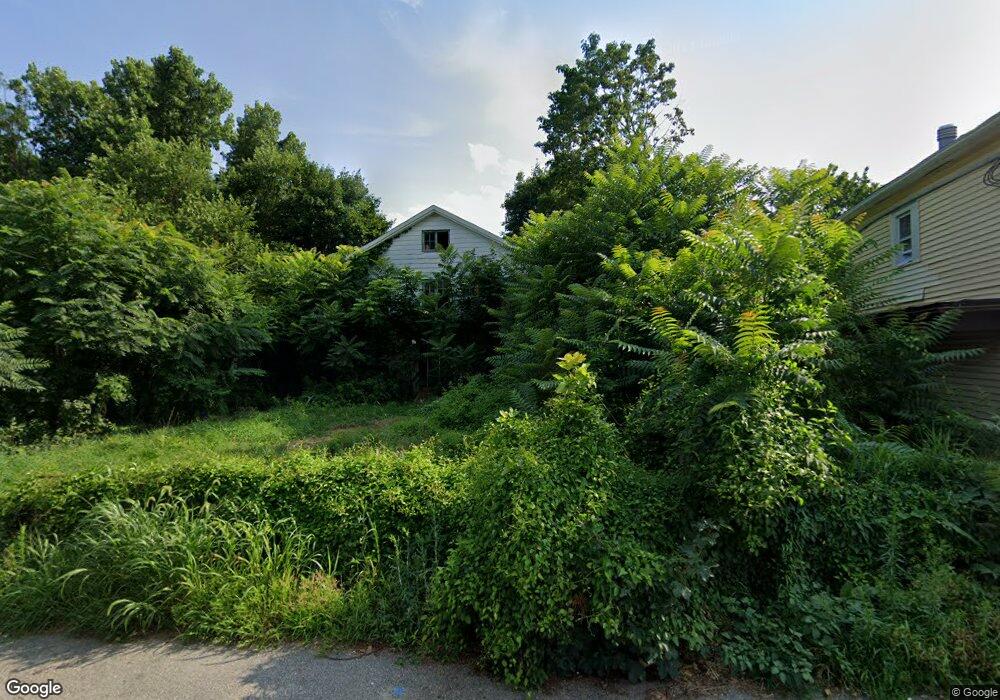
243 Broad St Norwich, CT 06360
Central Norwich NeighborhoodEstimated Value: $128,000 - $153,000
7
Beds
3
Baths
2,560
Sq Ft
$53/Sq Ft
Est. Value
About This Home
This home is located at 243 Broad St, Norwich, CT 06360 and is currently estimated at $135,080, approximately $52 per square foot. 243 Broad St is a home located in New London County with nearby schools including Moriarty Magnet Elementary School, Kelly STEAM Magnet Middle School, and Integrated Day Charter School.
Ownership History
Date
Name
Owned For
Owner Type
Purchase Details
Closed on
Mar 6, 2025
Sold by
Vernon Capital Llc
Bought by
Sky Circle Llc
Current Estimated Value
Purchase Details
Closed on
Jun 6, 2024
Sold by
Dependable Inv Llc
Bought by
Vernon Capital Llc
Purchase Details
Closed on
May 28, 2024
Sold by
Atterbury Anita Est and Busch
Bought by
Dependable Inv Llc
Create a Home Valuation Report for This Property
The Home Valuation Report is an in-depth analysis detailing your home's value as well as a comparison with similar homes in the area
Home Values in the Area
Average Home Value in this Area
Purchase History
| Date | Buyer | Sale Price | Title Company |
|---|---|---|---|
| Sky Circle Llc | $120,000 | None Available | |
| Sky Circle Llc | $120,000 | None Available | |
| Vernon Capital Llc | $100,000 | None Available | |
| Vernon Capital Llc | $100,000 | None Available | |
| Vernon Capital Llc | $100,000 | None Available | |
| Dependable Inv Llc | -- | None Available | |
| Dependable Inv Llc | -- | None Available | |
| Dependable Inv Llc | -- | None Available |
Source: Public Records
Tax History Compared to Growth
Tax History
| Year | Tax Paid | Tax Assessment Tax Assessment Total Assessment is a certain percentage of the fair market value that is determined by local assessors to be the total taxable value of land and additions on the property. | Land | Improvement |
|---|---|---|---|---|
| 2025 | $5,751 | $142,100 | $29,200 | $112,900 |
| 2024 | $5,428 | $142,100 | $29,200 | $112,900 |
| 2023 | $4,023 | $82,700 | $20,700 | $62,000 |
| 2022 | $4,009 | $82,700 | $20,700 | $62,000 |
| 2021 | $4,023 | $82,700 | $20,700 | $62,000 |
| 2020 | $4,008 | $82,700 | $20,700 | $62,000 |
| 2019 | $3,969 | $82,700 | $20,700 | $62,000 |
| 2018 | $3,973 | $82,100 | $24,300 | $57,800 |
| 2017 | $4,002 | $82,100 | $24,300 | $57,800 |
| 2016 | $4,028 | $82,100 | $24,300 | $57,800 |
| 2015 | $3,946 | $82,100 | $24,300 | $57,800 |
| 2014 | $3,771 | $82,100 | $24,300 | $57,800 |
Source: Public Records
Map
Nearby Homes