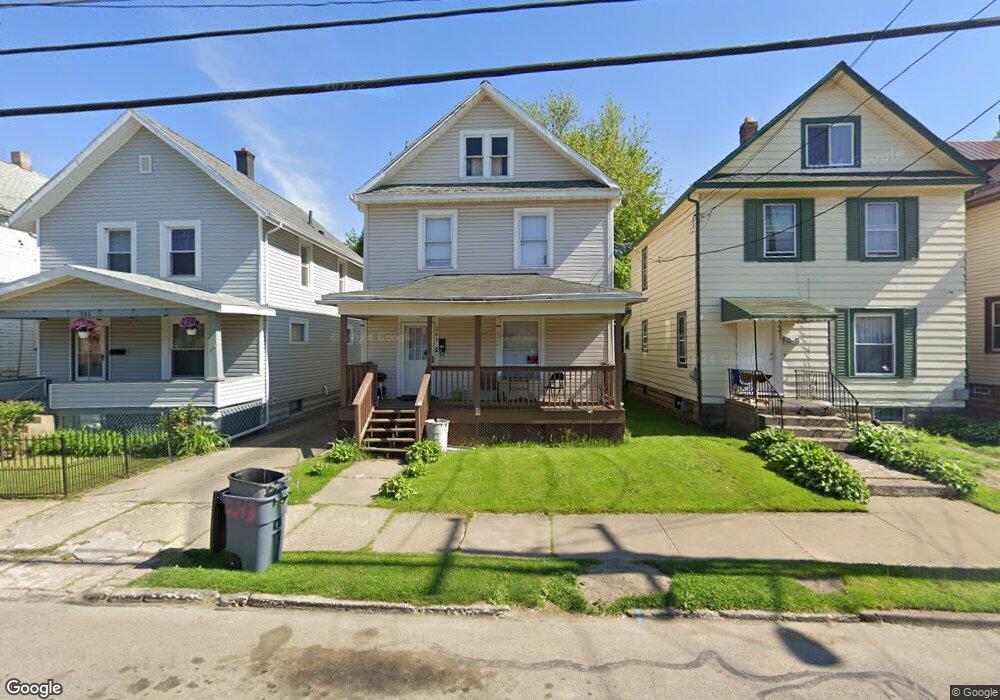
243 E 28th St Erie, PA 16504
Marvintown NeighborhoodEstimated Value: $106,000 - $140,000
4
Beds
1
Bath
1,320
Sq Ft
$89/Sq Ft
Est. Value
About This Home
This home is located at 243 E 28th St, Erie, PA 16504 and is currently estimated at $117,833, approximately $89 per square foot. 243 E 28th St is a home located in Erie County with nearby schools including Jefferson Elementary School, Woodrow Wilson Middle School, and Erie High School.
Ownership History
Date
Name
Owned For
Owner Type
Purchase Details
Closed on
Mar 5, 2009
Sold by
Banko James J
Bought by
Banko Adam J
Current Estimated Value
Purchase Details
Closed on
Aug 15, 2008
Sold by
Kramer John and Windsor Pamela
Bought by
Us Bank Na and Credit Suisse Heat 2005-9
Purchase Details
Closed on
Jul 29, 2005
Sold by
Rld Enterprises Of Erie Inc
Bought by
Kramer John and Windsor Thomas
Home Financials for this Owner
Home Financials are based on the most recent Mortgage that was taken out on this home.
Original Mortgage
$65,700
Interest Rate
7.92%
Mortgage Type
Fannie Mae Freddie Mac
Purchase Details
Closed on
Nov 1, 2004
Sold by
Washington Mutual Bank Fa
Bought by
Rld Enterprises Of Erie Inc
Home Financials for this Owner
Home Financials are based on the most recent Mortgage that was taken out on this home.
Original Mortgage
$30,000
Interest Rate
5.69%
Mortgage Type
Purchase Money Mortgage
Purchase Details
Closed on
Feb 10, 2004
Sold by
Gibson Susan R
Bought by
Washington Mutual Bank Fa and Washington Mutual Home Loans Inc
Create a Home Valuation Report for This Property
The Home Valuation Report is an in-depth analysis detailing your home's value as well as a comparison with similar homes in the area
Home Values in the Area
Average Home Value in this Area
Purchase History
| Date | Buyer | Sale Price | Title Company |
|---|---|---|---|
| Banko Adam J | -- | None Available | |
| Us Bank Na | $3,624 | None Available | |
| Kramer John | $73,000 | -- | |
| Rld Enterprises Of Erie Inc | $18,000 | -- | |
| Washington Mutual Bank Fa | $1,382 | -- |
Source: Public Records
Mortgage History
| Date | Status | Borrower | Loan Amount |
|---|---|---|---|
| Previous Owner | Kramer John | $65,700 | |
| Previous Owner | Rld Enterprises Of Erie Inc | $30,000 |
Source: Public Records
Tax History
| Year | Tax Paid | Tax Assessment Tax Assessment Total Assessment is a certain percentage of the fair market value that is determined by local assessors to be the total taxable value of land and additions on the property. | Land | Improvement |
|---|---|---|---|---|
| 2025 | $2,535 | $64,120 | $17,000 | $47,120 |
| 2024 | $2,481 | $64,120 | $17,000 | $47,120 |
| 2023 | $2,410 | $64,120 | $17,000 | $47,120 |
| 2022 | $2,360 | $64,120 | $17,000 | $47,120 |
| 2021 | $2,326 | $64,120 | $17,000 | $47,120 |
| 2020 | $2,310 | $64,120 | $17,000 | $47,120 |
| 2019 | $2,190 | $64,120 | $17,000 | $47,120 |
| 2018 | $2,164 | $64,120 | $17,000 | $47,120 |
| 2017 | $2,160 | $64,120 | $17,000 | $47,120 |
| 2016 | $2,425 | $64,120 | $17,000 | $47,120 |
| 2015 | $2,409 | $64,120 | $17,000 | $47,120 |
| 2014 | $2,078 | $64,120 | $17,000 | $47,120 |
Source: Public Records
Map
Nearby Homes
- 317 E 27th St
- 252 E 31st St
- 256 E 31st St
- 3114 Old French Rd
- 3122 Marvin Ave
- 241 E 24th St
- 3028 Holmes St
- 26 E 26th St
- 248 Maiden Ln
- 2216 German St
- 343 E 33rd St
- 2215 Holland St
- 213 E 34th St
- 2320 Wallace St
- 347 E 35th St
- 2206 Wallace St
- 517 E 33rd St
- 539 E 23rd St
- 0 W 21st St Unit 189010
- 249 Scott St
Your Personal Tour Guide
Ask me questions while you tour the home.