Estimated Value: $531,000 - $566,930
4
Beds
2
Baths
2,294
Sq Ft
$239/Sq Ft
Est. Value
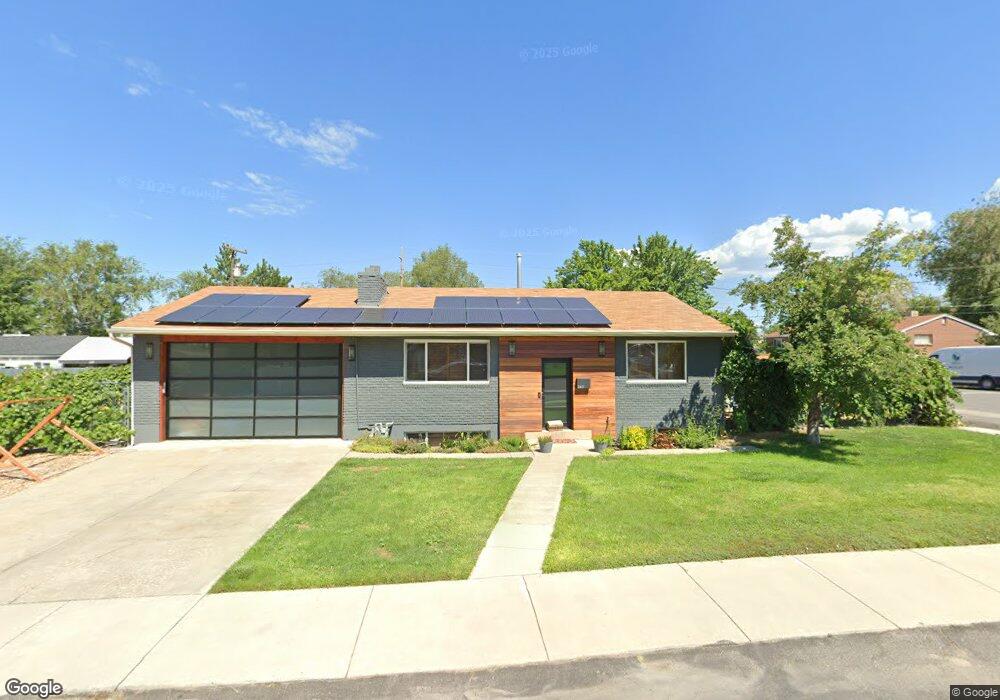
About This Home
This home is located at 243 E 8840 S, Sandy, UT 84070 and is currently estimated at $547,733, approximately $238 per square foot. 243 E 8840 S is a home located in Salt Lake County with nearby schools including Sandy Elementary School, Mount Jordan Middle School, and Jordan High.
Ownership History
Date
Name
Owned For
Owner Type
Purchase Details
Closed on
Nov 30, 2009
Sold by
Collier Derek
Bought by
Conover Allison M and Conover Terrence R
Current Estimated Value
Home Financials for this Owner
Home Financials are based on the most recent Mortgage that was taken out on this home.
Original Mortgage
$196,377
Outstanding Balance
$128,154
Interest Rate
4.91%
Mortgage Type
FHA
Estimated Equity
$419,579
Purchase Details
Closed on
May 7, 1998
Sold by
Collier Palmer and Collier Marjorie B
Bought by
Collier Palmer and Collier Marjorie B
Create a Home Valuation Report for This Property
The Home Valuation Report is an in-depth analysis detailing your home's value as well as a comparison with similar homes in the area
Home Values in the Area
Average Home Value in this Area
Purchase History
| Date | Buyer | Sale Price | Title Company |
|---|---|---|---|
| Conover Allison M | -- | Paramount Title | |
| Collier Palmer | -- | Paramount Title |
Source: Public Records
Mortgage History
| Date | Status | Borrower | Loan Amount |
|---|---|---|---|
| Open | Conover Allison M | $196,377 |
Source: Public Records
Tax History
| Year | Tax Paid | Tax Assessment Tax Assessment Total Assessment is a certain percentage of the fair market value that is determined by local assessors to be the total taxable value of land and additions on the property. | Land | Improvement |
|---|---|---|---|---|
| 2025 | -- | $536,300 | $134,500 | $401,800 |
| 2024 | -- | $498,200 | $123,400 | $374,800 |
| 2023 | $2,591 | $447,100 | $117,300 | $329,800 |
| 2022 | $2,591 | $466,700 | $115,000 | $351,700 |
| 2021 | $2,483 | $380,700 | $90,000 | $290,700 |
| 2020 | $2,338 | $338,000 | $90,000 | $248,000 |
| 2019 | $2,250 | $317,000 | $90,000 | $227,000 |
| 2016 | $1,756 | $237,900 | $64,800 | $173,100 |
Source: Public Records
Map
Nearby Homes
- 8558 S Center St
- 112 E 8680 S
- 220 E Pioneer Ave
- 194 Pioneer Ave
- 149 E Pioneer Ave
- 8459 S 300 E
- 8732 S 620 E
- 362 E 9150 S
- 8522 S Solar Way Unit 8522
- 87 Pioneer Ave
- 181 E 9180 S
- 8470 Solar Way
- 359 E 8400 S
- 48 E Apollo Way
- 87 W 8710 S
- 8729 S Leafwood Ln
- 487 E 9270 S
- 8797 Green Way Unit 3
- 144 E Chambord Ct
- 140 E Chambord Ct
Your Personal Tour Guide
Ask me questions while you tour the home.