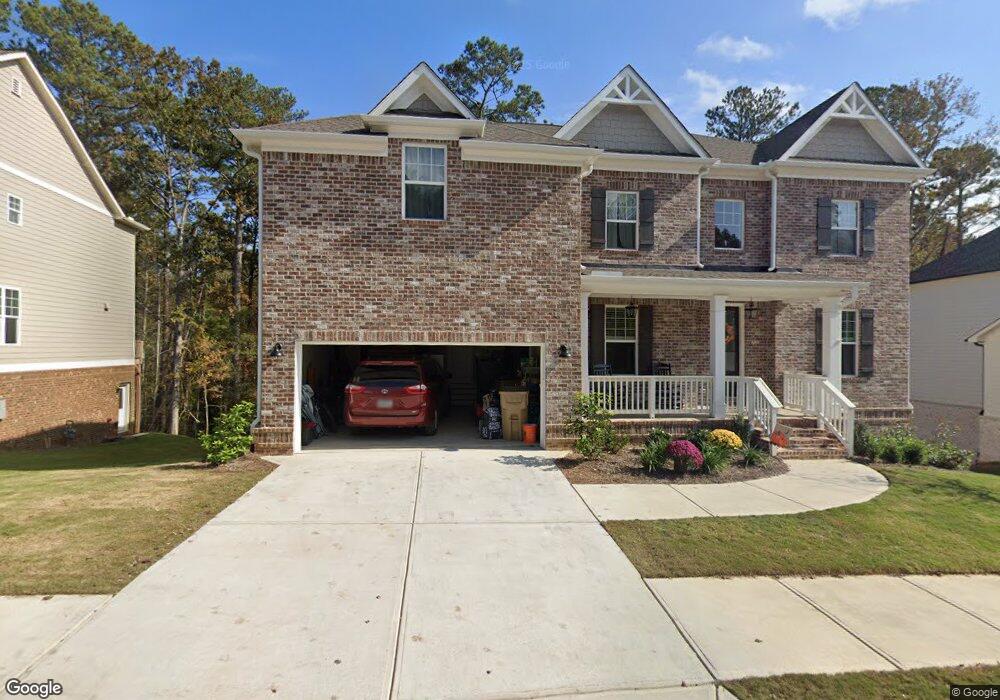
243 Harmony Lake Dr Unit 192 Canton, GA 30115
Estimated Value: $834,276 - $846,000
4
Beds
4
Baths
4,730
Sq Ft
$178/Sq Ft
Est. Value
About This Home
This home is located at 243 Harmony Lake Dr Unit 192, Canton, GA 30115 and is currently estimated at $840,138, approximately $177 per square foot. 243 Harmony Lake Dr Unit 192 is a home located in Cherokee County with nearby schools including Indian Knoll Elementary School, Rusk Middle School, and Sequoyah High School.
Ownership History
Date
Name
Owned For
Owner Type
Purchase Details
Closed on
Nov 14, 2022
Sold by
Tasdemir Nusret
Bought by
Tasdemir Nusret and Tasdemir Refet
Current Estimated Value
Purchase Details
Closed on
Jun 15, 2021
Sold by
Jordan Kevin J
Bought by
Tasdemir Nusret
Home Financials for this Owner
Home Financials are based on the most recent Mortgage that was taken out on this home.
Original Mortgage
$548,250
Interest Rate
2.9%
Mortgage Type
New Conventional
Purchase Details
Closed on
May 6, 2019
Sold by
Epic Homes Llc
Bought by
Jordan Kevin J and Jordan Megan R
Home Financials for this Owner
Home Financials are based on the most recent Mortgage that was taken out on this home.
Original Mortgage
$419,182
Interest Rate
4%
Purchase Details
Closed on
Dec 14, 2017
Sold by
Apex Development Partners
Bought by
Epic Homes Llc
Purchase Details
Closed on
Nov 9, 2017
Bought by
Apex Development Partners Llc
Create a Home Valuation Report for This Property
The Home Valuation Report is an in-depth analysis detailing your home's value as well as a comparison with similar homes in the area
Home Values in the Area
Average Home Value in this Area
Purchase History
| Date | Buyer | Sale Price | Title Company |
|---|---|---|---|
| Tasdemir Nusret | -- | -- | |
| Tasdemir Nusret | $578,500 | -- | |
| Jordan Kevin J | $434,725 | -- | |
| Epic Homes Llc | $160,000 | -- | |
| Apex Development Partners Llc | $385,000 | -- |
Source: Public Records
Mortgage History
| Date | Status | Borrower | Loan Amount |
|---|---|---|---|
| Previous Owner | Tasdemir Nusret | $548,250 | |
| Previous Owner | Jordan Kevin J | $419,182 |
Source: Public Records
Tax History
| Year | Tax Paid | Tax Assessment Tax Assessment Total Assessment is a certain percentage of the fair market value that is determined by local assessors to be the total taxable value of land and additions on the property. | Land | Improvement |
|---|---|---|---|---|
| 2025 | $15,172 | $321,680 | $56,800 | $264,880 |
| 2024 | $8,319 | $289,840 | $52,000 | $237,840 |
| 2023 | $7,795 | $259,320 | $52,000 | $207,320 |
| 2022 | $6,797 | $224,040 | $40,000 | $184,040 |
| 2021 | $4,691 | $186,920 | $27,000 | $159,920 |
| 2020 | $4,225 | $168,160 | $24,000 | $144,160 |
| 2019 | $3,755 | $149,320 | $24,000 | $125,320 |
| 2018 | $608 | $24,000 | $24,000 | $0 |
| 2017 | $206 | $60,000 | $24,000 | $0 |
| 2016 | $206 | $20,000 | $8,000 | $0 |
| 2015 | $208 | $20,000 | $8,000 | $0 |
| 2014 | $135 | $13,000 | $5,200 | $0 |
Source: Public Records
Map
Nearby Homes
- 243 Harmony Lake Dr
- 242 Harmony Lake Dr
- 408 Long Branch Way
- 207 Reserve Crossing
- 212 Reserve Crossing
- 626 Royal Crest Ct
- 642 Royal Crest Ct
- 810 Ravenstone Way
- 241 Royal Crescent Terrace
- 405 Royal Crescent Ln E
- 411 Royal Crescent Ln E
- 778 Crescent Cir
- 200 Cherokee Reserve Cir
- 333 Reserve Overlook
- 292 Harmony Lake Dr
- 213 Whitetail Cir
- 417 Darnell Rd
- 505 Hayes Ln
- 367 Reserve Overlook
- 513 Hayes Ln
- 245 Harmony Lake Dr Unit 193
- 245 Harmony Lake Dr
- 241 Harmony Lake Dr
- 241 Harmony Lake Dr Unit 191
- 237 Harmony Lake Dr
- 247 Harmony Lake Dr
- 247 Harmony Lake Dr Unit 194
- 239 Harmony Lake Dr Unit 190
- 239 Harmony Lake Dr
- 238 Harmony Lake Dr Unit 204
- 240 Harmony Lake Dr
- 236 Harmony Lake Dr
- 249 Harmony Lake Dr
- 234 Harmony Lake Dr
- 244 Harmony Lake Dr Unit 201
- 235 Harmony Lake Dr
- 301 Long Branch Ct
- 251 Harmony Lake Dr
- 251 Harmony Lake Dr Unit 196
- 404 Long Branch Way
Your Personal Tour Guide
Ask me questions while you tour the home.