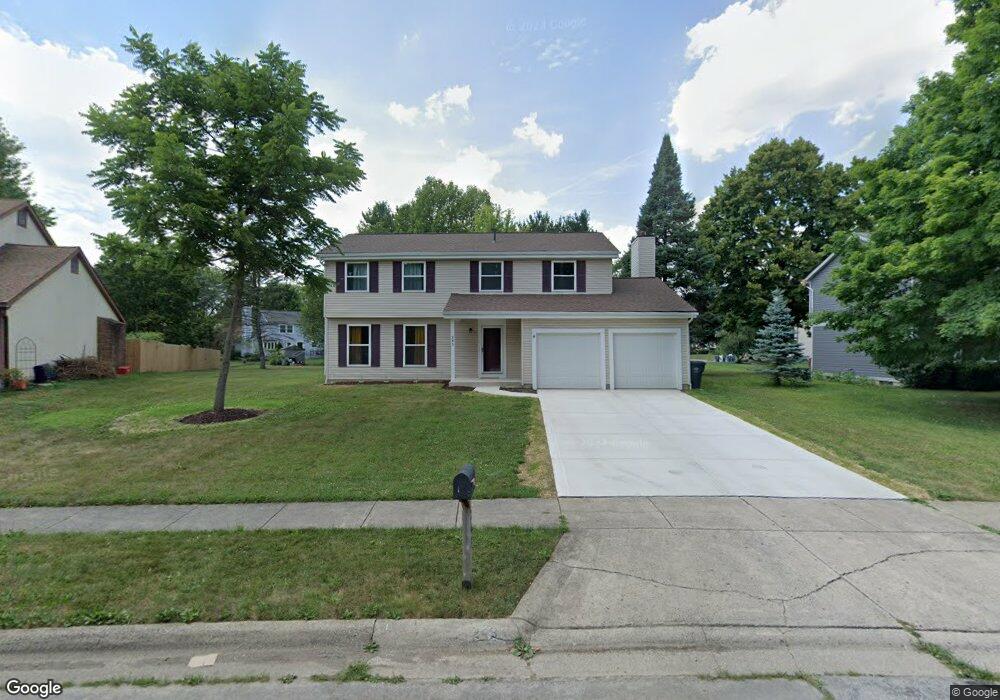
243 Highbury Crescent Columbus, OH 43230
Estimated Value: $396,000 - $423,000
4
Beds
3
Baths
1,960
Sq Ft
$210/Sq Ft
Est. Value
About This Home
This home is located at 243 Highbury Crescent, Columbus, OH 43230 and is currently estimated at $411,373, approximately $209 per square foot. 243 Highbury Crescent is a home located in Franklin County with nearby schools including Chapelfield Elementary School, Gahanna West Middle School, and Lincoln High School.
Ownership History
Date
Name
Owned For
Owner Type
Purchase Details
Closed on
Mar 11, 2024
Sold by
243 Highbury Crescent Llc
Bought by
Strous Kacia L and Slemmer Christopher J
Current Estimated Value
Home Financials for this Owner
Home Financials are based on the most recent Mortgage that was taken out on this home.
Original Mortgage
$555,000
Outstanding Balance
$547,179
Interest Rate
7.5%
Mortgage Type
New Conventional
Estimated Equity
-$135,806
Purchase Details
Closed on
Feb 28, 2024
Sold by
243 Highbury Crescent Llc
Bought by
Strous Kacia L and Slemmer Christopher J
Home Financials for this Owner
Home Financials are based on the most recent Mortgage that was taken out on this home.
Original Mortgage
$555,000
Outstanding Balance
$547,179
Interest Rate
7.5%
Mortgage Type
New Conventional
Estimated Equity
-$135,806
Purchase Details
Closed on
May 18, 2023
Sold by
Mitchell Dennis L and Mitchell Paula J
Bought by
243 Highbury Crescent Llc
Purchase Details
Closed on
Jan 6, 1997
Sold by
Fuller Todd E
Bought by
Mitchell Dennis L and Mitchell Paula J
Home Financials for this Owner
Home Financials are based on the most recent Mortgage that was taken out on this home.
Original Mortgage
$80,000
Interest Rate
7.6%
Mortgage Type
New Conventional
Purchase Details
Closed on
Apr 1, 1991
Purchase Details
Closed on
Nov 1, 1989
Create a Home Valuation Report for This Property
The Home Valuation Report is an in-depth analysis detailing your home's value as well as a comparison with similar homes in the area
Home Values in the Area
Average Home Value in this Area
Purchase History
| Date | Buyer | Sale Price | Title Company |
|---|---|---|---|
| Strous Kacia L | $420,000 | Apex Title | |
| Strous Kacia L | $420,000 | Apex Title | |
| 243 Highbury Crescent Llc | $50,000 | Apex Title | |
| Mitchell Dennis L | $132,500 | -- | |
| -- | $116,500 | -- | |
| -- | $109,900 | -- |
Source: Public Records
Mortgage History
| Date | Status | Borrower | Loan Amount |
|---|---|---|---|
| Open | Strous Kacia L | $555,000 | |
| Closed | Strous Kacia L | $555,000 | |
| Previous Owner | Mitchell Dennis L | $80,000 |
Source: Public Records
Tax History Compared to Growth
Tax History
| Year | Tax Paid | Tax Assessment Tax Assessment Total Assessment is a certain percentage of the fair market value that is determined by local assessors to be the total taxable value of land and additions on the property. | Land | Improvement |
|---|---|---|---|---|
| 2024 | $6,912 | $115,010 | $36,190 | $78,820 |
| 2023 | $7,811 | $115,010 | $36,190 | $78,820 |
| 2022 | $8,045 | $81,000 | $19,360 | $61,640 |
| 2021 | $6,367 | $81,000 | $19,360 | $61,640 |
| 2020 | $5,801 | $81,000 | $19,360 | $61,640 |
| 2019 | $4,869 | $67,840 | $16,140 | $51,700 |
| 2018 | $4,422 | $67,840 | $16,140 | $51,700 |
| 2017 | $4,469 | $67,840 | $16,140 | $51,700 |
| 2016 | $4,008 | $55,410 | $11,800 | $43,610 |
| 2015 | $4,011 | $55,410 | $11,800 | $43,610 |
| 2014 | $3,980 | $55,410 | $11,800 | $43,610 |
| 2013 | $1,976 | $55,405 | $11,795 | $43,610 |
Source: Public Records
Map
Nearby Homes
- 404 Foxwood Dr
- 464 Foxwood Dr
- 3610 N Stygler Rd
- 343 Imperial Dr
- 206 Lintner St
- 278 Empire Dr
- 470 Deerwood Ave E
- 373 Lyncroft Dr
- 364 Morgan Ln
- 209 Springbrook Place
- 600 Agler Rd
- 642 Ridenour Rd
- 183 Serran Dr
- 219 N Hamilton Rd
- 221 Lincolnshire Rd
- 463 Lincolnshire Rd
- 379 Heil Dr
- 311 N Hamilton Rd
- 390 Dunbarton Rd
- 668 Kenilworth Ct
- 235 Highbury Crescent
- 251 Highbury Crescent
- 207 Rugby Ct
- 259 Highbury Crescent
- 227 Highbury Crescent
- 230 Rugby Ln
- 220 Rugby Ln
- 217 Rugby Ct
- 244 Highbury Crescent
- 205 Rugby Ct
- 236 Highbury Crescent
- 214 Rugby Ln
- 267 Highbury Crescent
- 250 Highbury Crescent
- 229 Rugby Ln
- 229 Rugby Ct
- 221 Highbury Crescent
- 208 Rugby Ln
- 260 Highbury Crescent
- 186 Gothic Ct