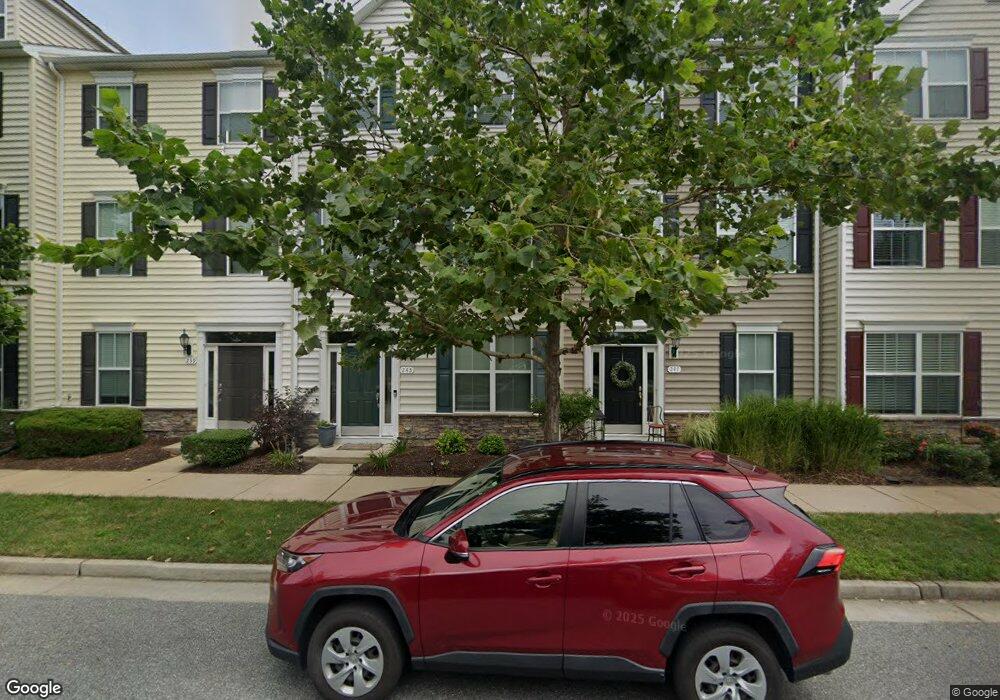
243 Keenan Way Stevensville, MD 21666
Estimated Value: $418,107 - $454,000
--
Bed
2
Baths
1,900
Sq Ft
$230/Sq Ft
Est. Value
About This Home
This home is located at 243 Keenan Way, Stevensville, MD 21666 and is currently estimated at $436,777, approximately $229 per square foot. 243 Keenan Way is a home located in Queen Anne's County with nearby schools including Kent Island Elementary School, Bayside Elementary School, and Matapeake Middle School.
Ownership History
Date
Name
Owned For
Owner Type
Purchase Details
Closed on
Oct 31, 2013
Sold by
Hoover Curtis C
Bought by
Hoover Curtis C and Hoover Sharon K
Current Estimated Value
Home Financials for this Owner
Home Financials are based on the most recent Mortgage that was taken out on this home.
Original Mortgage
$240,638
Outstanding Balance
$179,527
Interest Rate
4.24%
Mortgage Type
FHA
Estimated Equity
$257,250
Purchase Details
Closed on
Dec 19, 2012
Sold by
Lhi Ellendale Llc
Bought by
Hoover Curtis C and Ritter Britney Lee
Home Financials for this Owner
Home Financials are based on the most recent Mortgage that was taken out on this home.
Original Mortgage
$237,250
Interest Rate
3.35%
Mortgage Type
New Conventional
Purchase Details
Closed on
Jun 28, 2012
Sold by
Reliable Development Company Llc
Bought by
Lhi Ellendale Llc
Create a Home Valuation Report for This Property
The Home Valuation Report is an in-depth analysis detailing your home's value as well as a comparison with similar homes in the area
Home Values in the Area
Average Home Value in this Area
Purchase History
| Date | Buyer | Sale Price | Title Company |
|---|---|---|---|
| Hoover Curtis C | -- | Newlyn Title Assurance Co In | |
| Hoover Curtis C | -- | Newlyn Title Assurance Co In | |
| Hoover Curtis C | $263,630 | Newlyn Title Assurance Co In | |
| Lhi Ellendale Llc | $425,000 | Attorneys Title & Escrow Com |
Source: Public Records
Mortgage History
| Date | Status | Borrower | Loan Amount |
|---|---|---|---|
| Open | Hoover Curtis C | $240,638 | |
| Closed | Hoover Curtis C | $240,638 | |
| Closed | Hoover Curtis C | $237,250 |
Source: Public Records
Tax History Compared to Growth
Tax History
| Year | Tax Paid | Tax Assessment Tax Assessment Total Assessment is a certain percentage of the fair market value that is determined by local assessors to be the total taxable value of land and additions on the property. | Land | Improvement |
|---|---|---|---|---|
| 2025 | $3,101 | $351,900 | $0 | $0 |
| 2024 | $3,101 | $329,200 | $0 | $0 |
| 2023 | $2,887 | $306,500 | $125,000 | $181,500 |
| 2022 | $2,835 | $301,000 | $0 | $0 |
| 2021 | $2,781 | $295,500 | $0 | $0 |
| 2020 | $2,781 | $290,000 | $125,000 | $165,000 |
| 2019 | $2,748 | $286,467 | $0 | $0 |
| 2018 | $2,714 | $282,933 | $0 | $0 |
| 2017 | $2,680 | $279,400 | $0 | $0 |
| 2016 | -- | $275,433 | $0 | $0 |
| 2015 | $288 | $271,467 | $0 | $0 |
| 2014 | $288 | $267,500 | $0 | $0 |
Source: Public Records
Map
Nearby Homes
- 119 Keenan Way
- 912 Moorings Cir Unit 8
- 105 Amanda Frances Ln
- 920 Moorings Cir Unit 6
- 858 Moorings Cir Unit 11
- 821 Moorings Cir Unit 144
- 103 Liam Thomas Ln
- 315 Allison Jane Dr Unit G-20
- 127 Topside Dr
- 247 Breeding Blvd
- 233 Jessica Lyn Ave
- Townhome Plan at Ellendale Towns
- Townhome - End Unit Plan at Ellendale Towns
- 260 Moorings Cir Unit 118
- 241 Jessica Lyn Ave
- Sanctuary Plan at Ellendale Towns - Ellendale at Kent Island
- 736 Moorings Cir Unit 35
- 298 Moorings Cir
- 349 Topside Dr
- 312 Topside Dr Unit 223
- 243 Keenan Way Unit B-9
- 239 Keenan Way Unit B-10
- 239 Keenan Way
- 247 Keenan Way
- 247 Keenan Way Unit B-8
- 253 Keenan Way
- 253 Keenan Way Unit B-7
- 233 Keenan Way Unit B-11
- 227 Keenan Way Unit B-12
- 227 Keenan Way
- 223 Keenan Way
- 223 Keenan Way Unit B-13
- 135 Branta Landing
- 135 Branta Landing Unit B-29
- 139 Branta Landing
- 143 Branta Landing
- 143 Branta Landing Unit B-31
- 219 Keenan Way
- 219 Keenan Way Unit B-14
- 131 Branta Landing