Estimated Value: $632,913 - $969,000
4
Beds
4
Baths
2,898
Sq Ft
$268/Sq Ft
Est. Value
About This Home
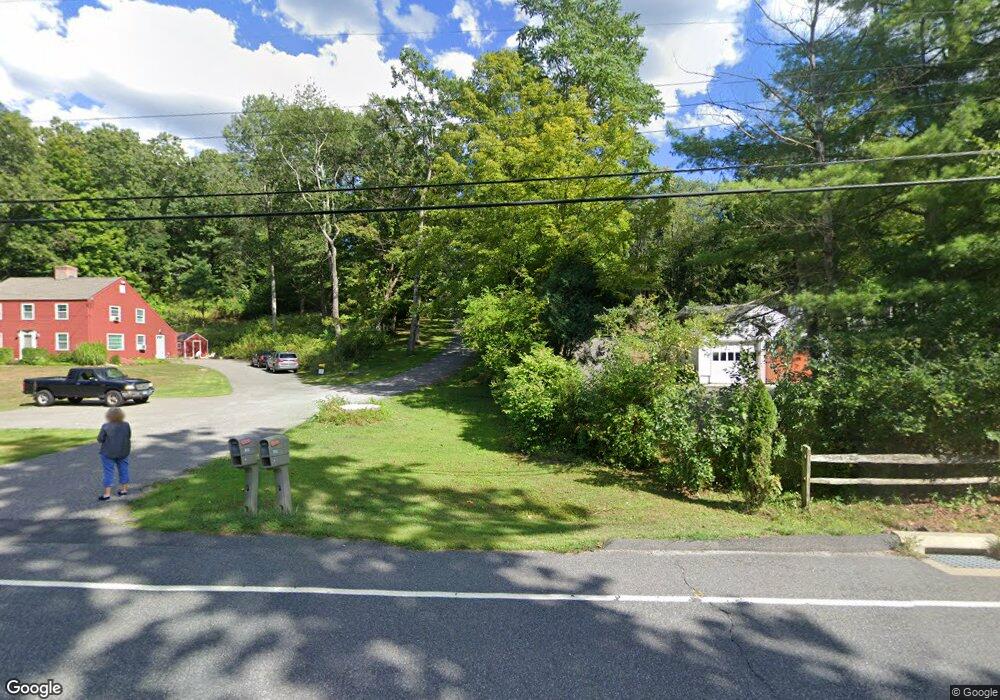
This home is located at 243 Kent Rd, Kent, CT 06757 and is currently estimated at $777,228, approximately $268 per square foot. 243 Kent Rd is a home located in Litchfield County with nearby schools including Kent Center School, Housatonic Valley Regional High School, and South Kent School.
Ownership History
Date
Name
Owned For
Owner Type
Purchase Details
Closed on
Jul 2, 1999
Sold by
Terrell Franklin D and Terrell Adele
Bought by
Harvey Wendy T and Harvey Scott R
Current Estimated Value
Home Financials for this Owner
Home Financials are based on the most recent Mortgage that was taken out on this home.
Original Mortgage
$118,000
Outstanding Balance
$32,088
Interest Rate
7.19%
Estimated Equity
$745,140
Create a Home Valuation Report for This Property
The Home Valuation Report is an in-depth analysis detailing your home's value as well as a comparison with similar homes in the area
Home Values in the Area
Average Home Value in this Area
Purchase History
We collect this data history from publicly available records. To have your information removed, we recommend requesting removal directly through your county’s website.
| Date | Buyer | Sale Price | Title Company |
|---|---|---|---|
| Harvey Wendy T | $118,000 | -- |
Source: Public Records
Mortgage History
We collect this data history from publicly available records. To have your information removed, we recommend requesting removal directly through your county’s website.
| Date | Status | Borrower | Loan Amount |
|---|---|---|---|
| Open | Harvey Wendy T | $118,000 |
Source: Public Records
Tax History
| Year | Tax Paid | Tax Assessment Tax Assessment Total Assessment is a certain percentage of the fair market value that is determined by local assessors to be the total taxable value of land and additions on the property. | Land | Improvement |
|---|---|---|---|---|
| 2025 | $6,674 | $395,600 | $69,300 | $326,300 |
| 2024 | $6,167 | $395,600 | $69,300 | $326,300 |
| 2023 | $5,394 | $287,500 | $77,000 | $210,500 |
| 2022 | $5,339 | $287,500 | $77,000 | $210,500 |
| 2021 | $5,339 | $287,500 | $77,000 | $210,500 |
| 2020 | $5,350 | $287,500 | $77,000 | $210,500 |
| 2019 | $5,350 | $287,500 | $77,000 | $210,500 |
| 2018 | $4,952 | $266,100 | $86,200 | $179,900 |
| 2017 | $4,952 | $266,100 | $86,200 | $179,900 |
| 2016 | $4,790 | $261,300 | $86,200 | $175,100 |
| 2015 | $4,488 | $251,300 | $86,200 | $165,100 |
| 2014 | $4,280 | $251,300 | $86,200 | $165,100 |
Source: Public Records
Map
Nearby Homes
- 231 Kent Rd
- 6A Birch Hill Ln
- 46 Spooner Hill Rd
- 0 Spooner Hill Rd Unit 24077524
- 0 Aldrich Rd
- 14 SE Mountain Rd
- 73 Long River Rd
- 40 Long River Rd
- 6 River Bend Ln
- 41 Long River Rd
- 32 Long River Rd
- 60 Long River Rd
- 113 Dog Tail Corners Rd
- 101 S Kent Rd
- 100 S Kent Rd
- 4 Pond View Ln
- 609 Long Mountain Rd
- 2 Pond View Ln
- 804-806 Berkshire Rd Unit 806
- 23 Clearview Rd
Your Personal Tour Guide
Ask me questions while you tour the home.